A Watchlist is a table containing a list of instruments. Various trading information is available for each instrument: OHLC, Last, Volume, Bid/Ask ecc.
Use a watchlist:
- to monitor an instrument list
- to link the instrument list to Charts / DOMs / Time & Sales etc. via Instrument Link
Create a new Watchlist #
You can create a new Watchlist in one of the following ways:
1. From Workspace window > New menu > Watchlist > New
2. From Workspace window > Tool Windows toolbar > Watchlist button > New
Complete the creation process by defining a unique name for the watchlist.
Open an existing Watchlist #
When you close a watchlist, it is not deleted. You can reopen it in one of the following ways:
1. From Workspace window > New menu > Watchlist > select the watchlist to reopen
2. From Workspace window > Tool Windows toolbar> Watchlist button > select the watchlist to reopen
Delete a Watchlist #
When you close a watchlist, it is not permanently deleted but can be reopened later. To permanently delete the window, press gear button at the top right of watchlist window, then select Delete Watchlist.
Instruments #
A Watchlist is a table containing a list of instruments.
Add Instrument/s #
You can add one or more instruments to a watchlist in one of the following ways:
1. Right click on list > Add Instruments
2. Press gear button at the top right of watchlist window > Add Instruments
Remove Instrument/s #
You can remove an instrument from a watchlist in one of the following ways:
1. Right click on list > Remove Instrument
2. Press gear button at the top right of watchlist window > Remove Selected Instrument
You can remove all instruments from a watchlist in one of the following ways:
1. Right Click on list > Remove all Instruments
2. Press gear button at the top right of watchlist window > Remove all Instruments
Sub-List #
Within the same Watchlist window you can create different instrument lists (sub-lists). Each sub-List will correspond to a Tab in the Watchlist window.
You can Add, Rename, Delete a sub-List by pressing the gear button at the top right of watchlist window and selecting the respective menu item.
Available Columns #
In a watchlist, there are many columns containing various information.
For each sub-List you can choose which columns to be displayed. Access Edit Columns window to choose which columns to display and their position.
To access Edit Columns window:
- Right Click on list > Edit Columns
- or press gear button at the top right of watchlist window > Edit Columns
Below, the available columns:
Real Time Status: instrument real-time status:
- Green dot = Subscribed
- Yellow dot = Subscribing
- Red dot = Subscription failed (incorrect instrument symbol or not available on data-feed)
- Gray dot = Data-Feed disconnected
Symbol: instrument symbol
Name/Description: instrument name or description
Last: last traded price
Last Size: last traded size
Net Change (points): change (in points) between prev. session close and current Last
Net Change (%): change (in percentage) between prev. session close and current Last
Time: time of last price received
# Bid: if available, it represents total number of orders in the Best Bid price level
Bid Size: Best Bid size
Bid: Best Bid price
Ask: Best Ask price
Ask Size: Best Ask size
# Ask: if available, it represents total number of orders in the Best Ask price level
Total Volume: represents current session total volume
Open: current session open price
High: current session high
Low: current session low
Date: current session date
Prev. Close: prev. session close
Prev. Settlement: prev. session settlement
Open Interest: if available, it represents instrument open interest
You can relocate columns as you like using Drag & Drop (by selecting the column and dragging it to the right or left while holding down left mouse button and releasing it once the desired location is reached), or from Edit Columns window.
Open Chart / DOM / Order-Entry from Watchlist #
You can quickly open a new Chart, DOM or Order-Entry of an instrument from Watchlist context menu:
- Right Click on instrument in the list > Place New Order to open a new Order-Entry window
- Right Click on instrument in the list > Open New DOM to open a new DOM
- Right Click on instrument in the list > Open New Chart to open a new Chart
Link Watchlist to a Chart / DOM / T&S #
Using instrument-Link you can link the Watchlist window to one or more Chart, DOM, Time & Sales, Order-Entry etc. windows. Instrument-Link allows you to automatically change the instrument on linked Charts, DOMs, T&Ss.
To link the Watchlist to a chart, please follow these steps:
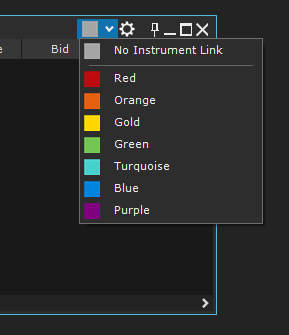
1. Select a color from instrument-link available color list at the top right of Watchlist window:

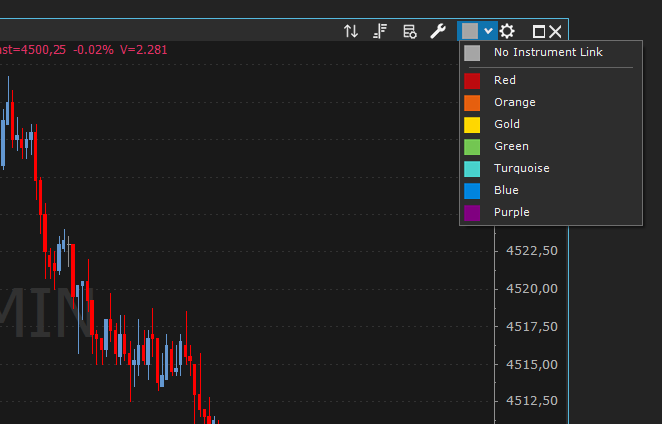
2. Select the same color chosen for watchlist, on instrument-link at the top right of chart window:

3. That’s all! Now the two windows are linked to each other and moving between instruments in the watchlist, chart displayed will correspond to the instrument selected in the watchlist.
4. To link other windows, set the same color chosen in the watchlist also in the other windows, exactly as you did with chart.
We do not recommend linking the watchlist to a chart if the chart takes a long time to load/calculate
It is NOT possible to use the instrument-Link on a watchlist window containing more than one sub-List.
Export #
You can export current list to memory or to a text file (txt or csv), in one of the following ways:
1. Right click on list > Export
2. Press gear button at the top right of watchlist window > Export


