

All backtest results of a strategy are contained in a detailed report. In particular, the report contains the results of all Option combinations sorted according to the sorting criteria chosen when launching the backtest. For each Option combination, detailed statistics on positions, trades executed, equity, etc. are available.
Access the Report #
You can access the report in one of the following ways:
- from Report list > Double click on the report name
- or select the report in the list > press Show Report button in the toolbar above report list
- or select the report in the list > Right click > Show Report
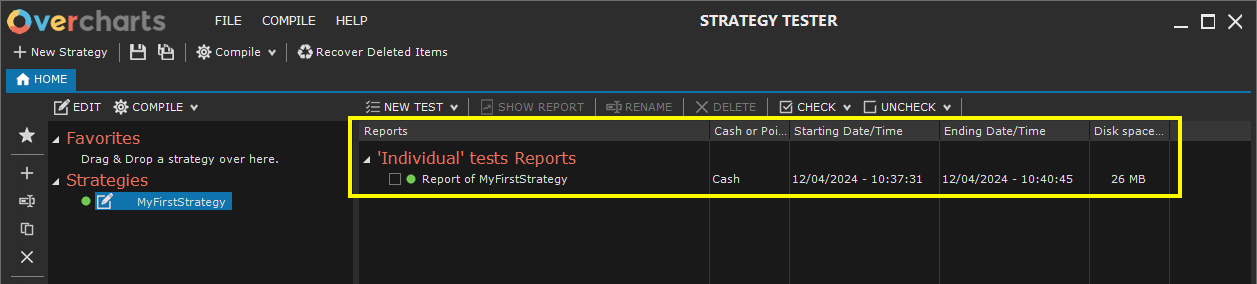
The report Tab (where all trading systems and instruments tested are listed) opens.
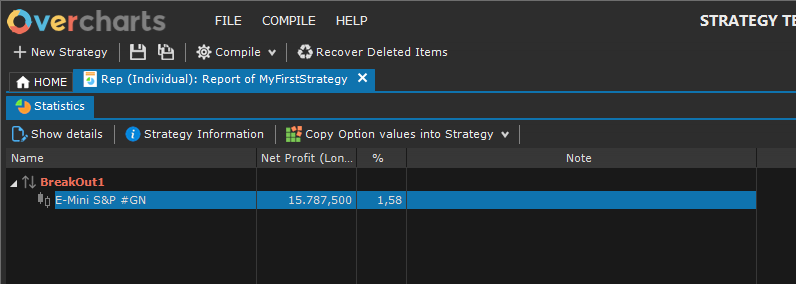
Access instrument results, in one of the following ways:
- Statistics Tab > Double click on the instrument
- or Statistics Tab > select the instrument in the list > press Show Details button
From Statistics Tab > Strategy Information button, you can view the configuration of the strategy used to generate the report.
Report #
For each trading system / instrument, the results of the various Option combinations are available, sorted according to the sorting criteria chosen when launching the backtest.
Options are special properties defined in the trading system source code.
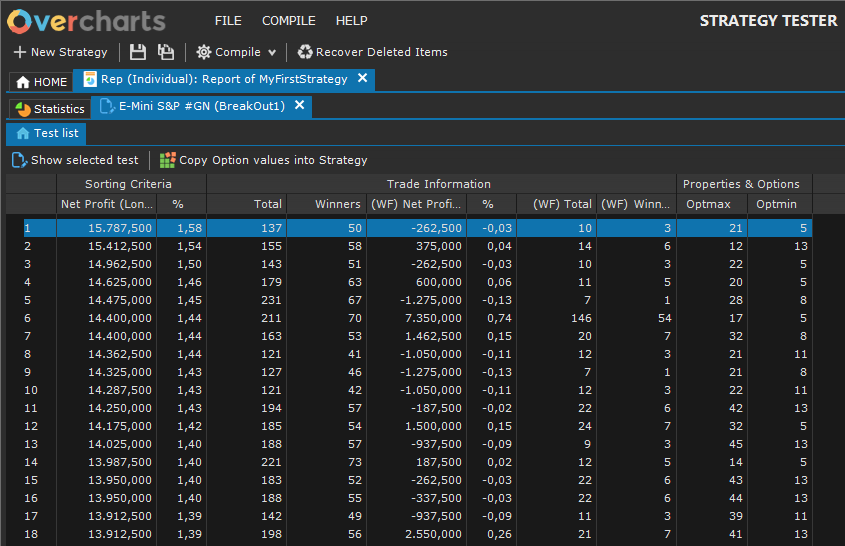
Each single item in the list represents a complete test of the trading system / instrument, performed using specific Option values. If you have NOT used Options in your trading system, only one element will be present.
You can access the test results, in one of the following ways:
- Double click on the test
- or select the test > press Show selected test button
Test Tab will open. It contains all general statistics, signals / trades, capital performance, etc. divided by Optimization and Walk Forward (the Walk Forward section is present only if set in the strategy configuration).
In particular:
– Optimization Tab contains all statistics generated from the portion of the data series used for optimizing the trading system;
– Walk Forward Tab contains all statistics generated from the portion of the data series where the application of the trading system to the market is simulated. This allows you to check whether the results produced during the optimization can be replicated in the “real” market.
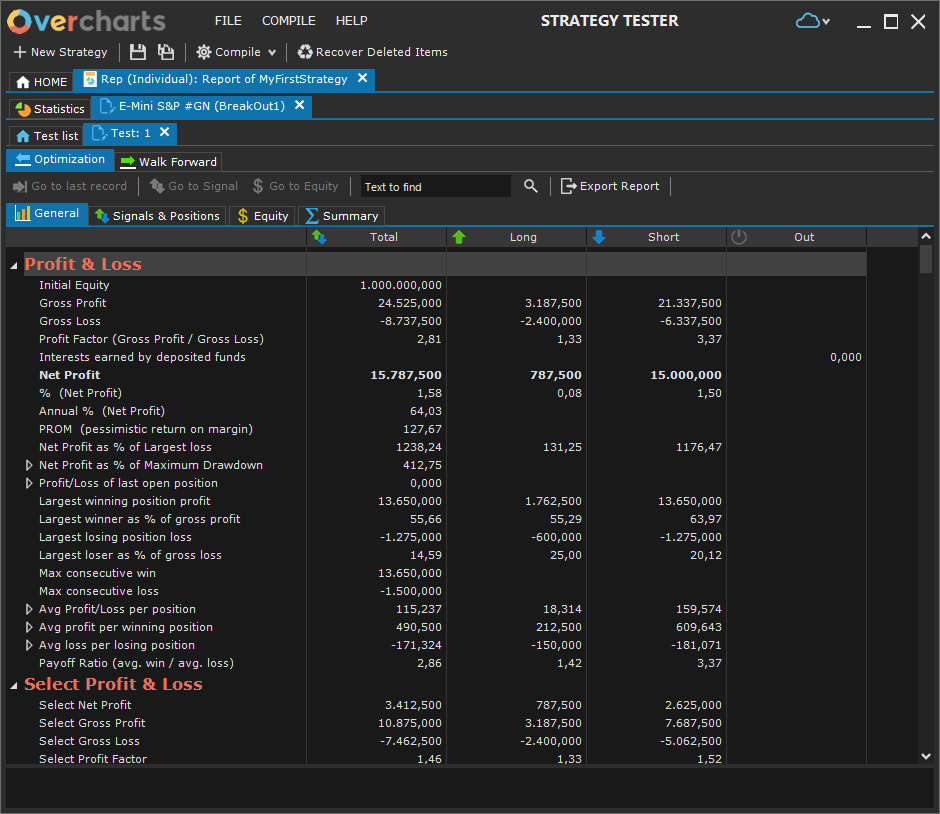
General Statistics #
Below are the general statistics available:
Profit & Loss #
- Initial Equity: initial equity available.
- Gross Profit: sum of profits generated by all (winning) positions net of commissions.
- Gross Loss: sum of losses generated by all (losing) positions gross of commissions.
- Profit Factor (Gross Profit / Gross Loss): ratio between profits and losses. The higher the value, the greater the profits in relation to the losses.
- Interests earned by deposited funds: bank interest accrued from funds not used in the positions.
- Net Profit: (value expressed in currency, as a percentage and as an annualized percentage) value of profits/losses including commissions paid and any interest accrued.
- PROM (pessimistic return on margin): annualized rate of return calculated on the basis that a trading strategy will produce lower profits and higher losses during its real use compared to simulation.
- Net Profit as % of Largest loss: percentage of profits in relation to maximum loss.
- Net Profit as % of Maximum Drawdown: percentage of profits in relation to maximum drawdown.
- Profit / Loss of last open position: profit/loss of the last open operation.
- Largest winning position profit: largest profit obtained from a single trade.
- Largest winner as % of gross profit: (percentage) greater profit in relation to total profits. In other words, it represents the weight of the trade that obtained the highest profit, on total profits generated.
- Largest losing position loss: largest loss obtained from a single trade.
- Largest loser as % of gross loss: (percentage) greater loss in relation to total losses. In other words, it represents the weight of the trade that generated the greatest loss, on total losses.
- Max consecutive win: maximum profit generated by a consecutive series of winning trades.
- Max consecuitive loss: maximum loss generated by a consecutive series of losing trades.
- Avg Profit/Loss per position: average profit/loss for each position (without distinction between winning and losing trades).
- Avg profit per winning position: average profit per winning position.
- Avg loss per losing position: average profit per losing position.
- Payoff Ratio (avg. win / avg. loss): ratio between average profits and average losses. The higher the value, the greater the profits in relation to the losses.
Select Profit & Loss #
Select profits/losses DO NOT include trades whose outcome, whether positive or negative, is greater than three times standard deviation. These are trades that probably obtained such positive (negative) results only thanks to (or because of) extraordinary situations.
- Select Net Profit: value of profits/losses including commissions paid and any interest accrued.
- Select Gross Profit: sum of profits generated by all (winning) positions net of commissions.
- Select Gross Loss: sum of losses generated by all (losing) positions gross of commissions.
- Select Net Profit as % of Largest loss: percentage of profits in relation to maximum loss.
- Select Net Profit as % of Maximum Drawdown: percentage of profits in relation to maximum drawdown.
Costs & Commissions #
- Commissions Paid: total commissions paid.
- Slippage: total slippage of all trades.
Positions #
- Total closed Positions: total number of closed positions (winners + losers + even).
- (%) winning positions on totals: percentage of winning positions out of total positions.
- Winning Positions: total number of winning positions closed.
- Losing Positions: total number of losing positions closed.
- Even positions (no profit/loss): number of positions with profit / loss equal to zero.
- Most consecutive wins: maximum number of consecutive winning positions. Trades with zero profit/loss do NOT break the sequence.
- Most consecutive losses: maximum number of consecutive losing positions. Trades with zero profit/loss do NOT break the sequence.
Periods (Bars) #
- Bars in positions: number of data series bars tested.
- Bars out of market: number of bars the system has been flat (out of market).
- Bars in the market: number of bars the system has been in position.
- Bars in winning positions: total number of bars involved in winning positions.
- Bars in losing positions: total number of bars involved in losing positions.
- Bars in even positions (no profit/loss): number of total bars involved in positions with zero profit/loss.
- Bars of longest winning position: number of bars involved in the longest winning trade.
- Bars of longest losing position: number of bars involved in the longest losing trade.
- Bars of last open position: number of bars involved in the last trade (if still open).
- Maximum number of bars between two positions: maximum number of bars between exiting one position and entering the next. In other words, it represents the maximum number of bars the system has been flat (out of market) between one position and the next.
- Average number of bars between two positions: average number of bars between exiting one position and entering the next. In other words, the average number of bars the system has been flat (out of the market) between positions. It is calculated as: Bars out of market / Total closed positions. The data can be very imprecise in “stop and reverse” systems or with few trades.
- ‘Out of market’ average length: average length (in bars) of the periods in which the system is flat (out of market).
- Position average length: average length (in bars) of the position.
- Average length of winning positions: average length (in bars) of a winning position.
- Average length of losing positions: average length (in bars) of a losing position.
- Average length of even positions: average length (in bars) of a position with profit/loss equal to zero.
Drawdown #
The Drawdown measures the trading system historical risk by indicating maximum loss produced by the system before becoming profitable. For example, if the initial equity is $10,000 and drops to $9,000 before returning above $10,000, the system drawdown will be $1,000 (10%). Below are the available statistics:
- ‘Open position’ maximum drawdown referring to the initial equity: maximum loss (below the initial equity) obtained with an open position during the entire test.
- ‘Closed position’ maximum drawdown referring to the initial equity: maximum loss (below the initial equity) obtained with a closed position during the entire test.
- Maximum equity drawdown: maximum equity drawdown from its relative maximum to a relative minimum.
- Maximum Drawdown as % of Initial Equity: (percentage) maximum negative excursion of equity in relation to the initial capital.
- Maximum number of periods to recover equity drawdown: maximum number of bars necessary for equity to recover its relative maximum starting from the next relative minimum.
- Maximum Drawdown in open position: maximum drawdown in open position. It may be greater than the loss recorded when the position was closed.
- Average Drawdown in open position: average drawdown in open position.
Run up #
Run-up indicates the maximum profit produced by the system in reference to the initial equity or to the single trade (both open and closed position). Below are the available statistics:
- ‘Open position’ maximum Run-up referring to the initial equity: maximum profit (above the initial equity) obtained on an open position during the entire test.
- ‘Closed position’ maximum Run-up referring to the initial equity: maximum profit (above the initial equity) obtained on a closed position during the entire test.
- Maximum equity Run-up: maximum equity excursion during the entire period under test, measured from its lowest to its highest value.
- Maximum Run-up in open position: maximum profit obtained during a single open position. This is the profit that would have been obtained by closing the position at the highs / lows depending on the type of position (long / short).
- Average Run-up in open position: average run-up in open position.
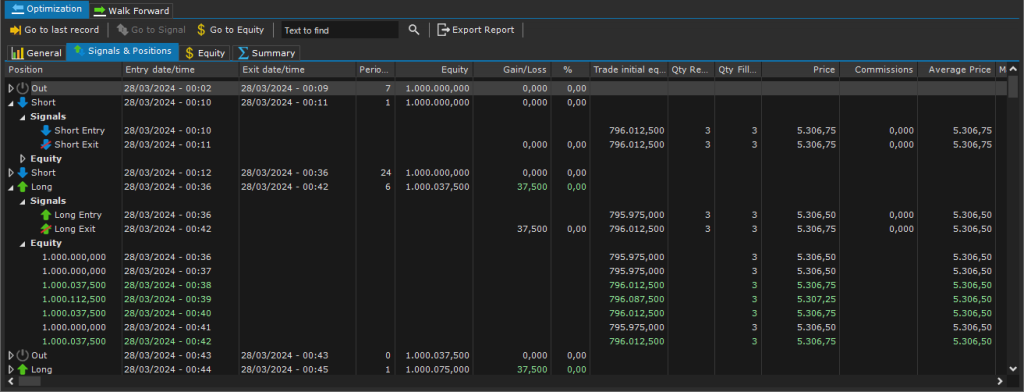
Signals & Positions #
All trades / signals performed by trading system are listed in the Signals & Positions Tab. For each trade / signal, information is available such as: position / signal type (long / short / out), the date /time of entry and exit, the number of periods (bars) involved, the profit/loss generated, quantity and average price, slippage, drawdown, commissions, and capital evolution for each signal.
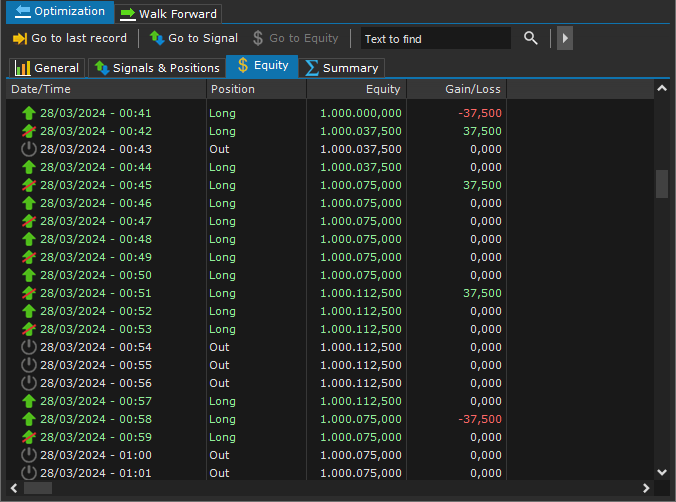
Equity #
In the Equity Tab, equity evolution is available in detail (for the entire period under test).
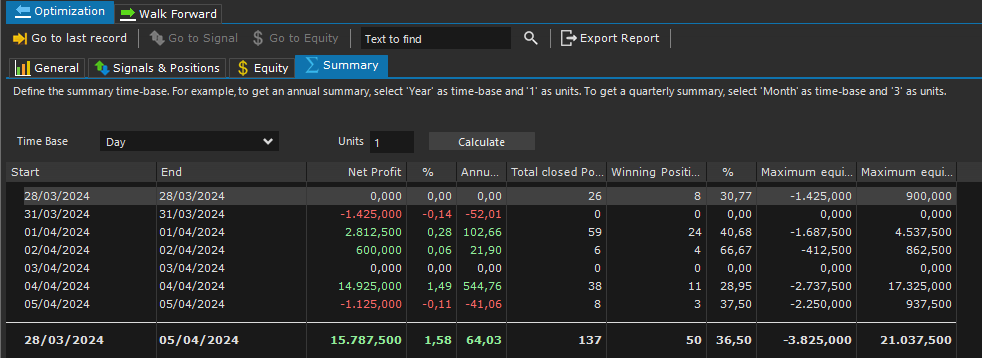
Summary #
In the Summary Tab you can group the most important test statistics by x Hours, Days, Weeks, Months, Years.
Export the Report #
You can export the entire report to a text file (.txt or .csv) for later use in Excel or other apps.
To export the report, press Export Report button in the toolbar at the top of the Optimization or Walk Forward Tab.


