Oanda is one of the most famous CFD and Forex brokers in the world.
Warnings
- In general, Forex and CFD data cannot be used for volume analysis through indicators such as Volume Profile, TPO Profile, Volume Ladder (footprint), Volume Delta etc. and more generally all volumetric indicators. In this type of instrument, volume is not valued or is unreliable.
For a correct volume analysis on forex instruments, you need to use forex futures and then use data-feeds such as, for example, CQG/StoneX, Rithmic, dxFeed, etc.
- Oanda does not provide 1-tick historical data. This is another reason why you cannot use indicators like Volume Profile, Volume Ladder (footprint) etc.
How to connect Overcharts to Oanda #
To connect Overcharts to Oanda, please follow these steps carefully:
1. Oanda Account – If you do not already have an Oanda demo or real account, please create a new one from Oanda official website.
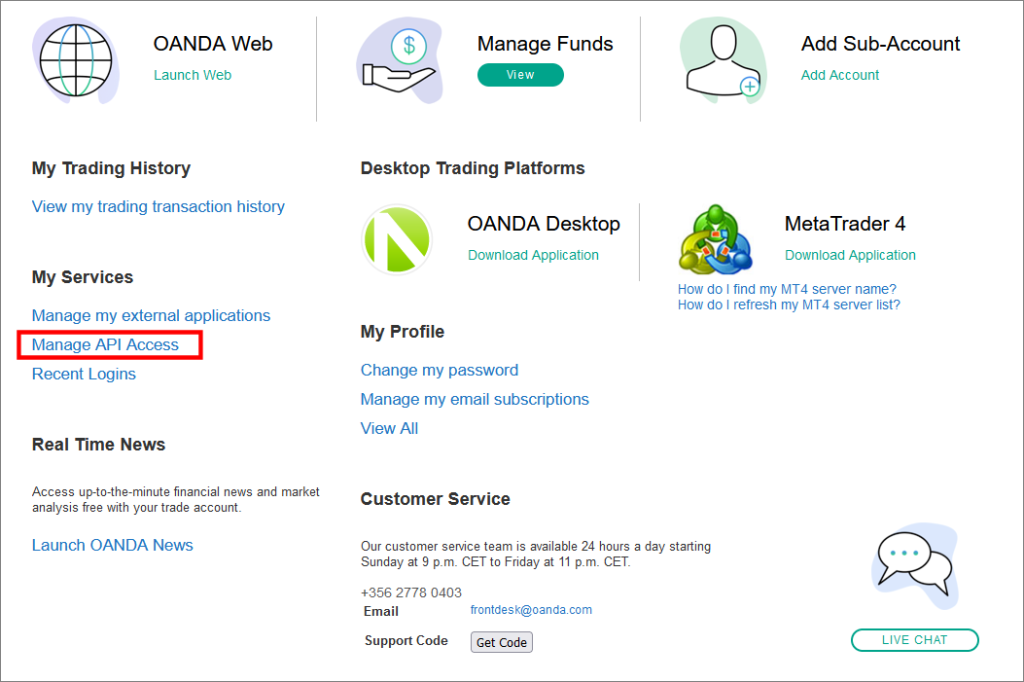
2. Access your Oanda account from the Oanda website
3. Click on Manage API Access:

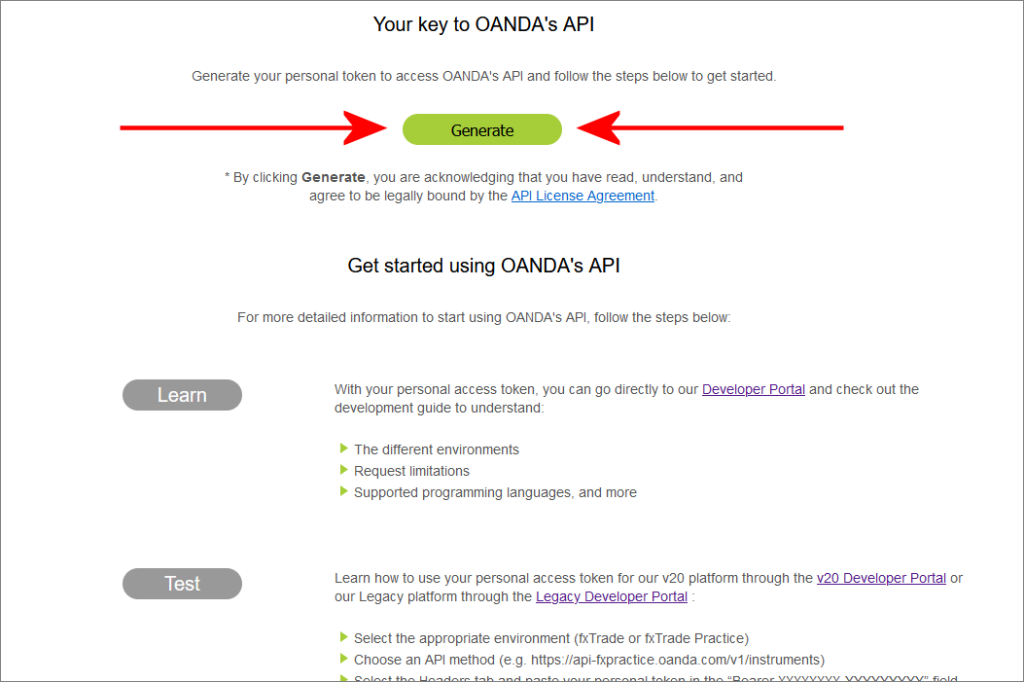
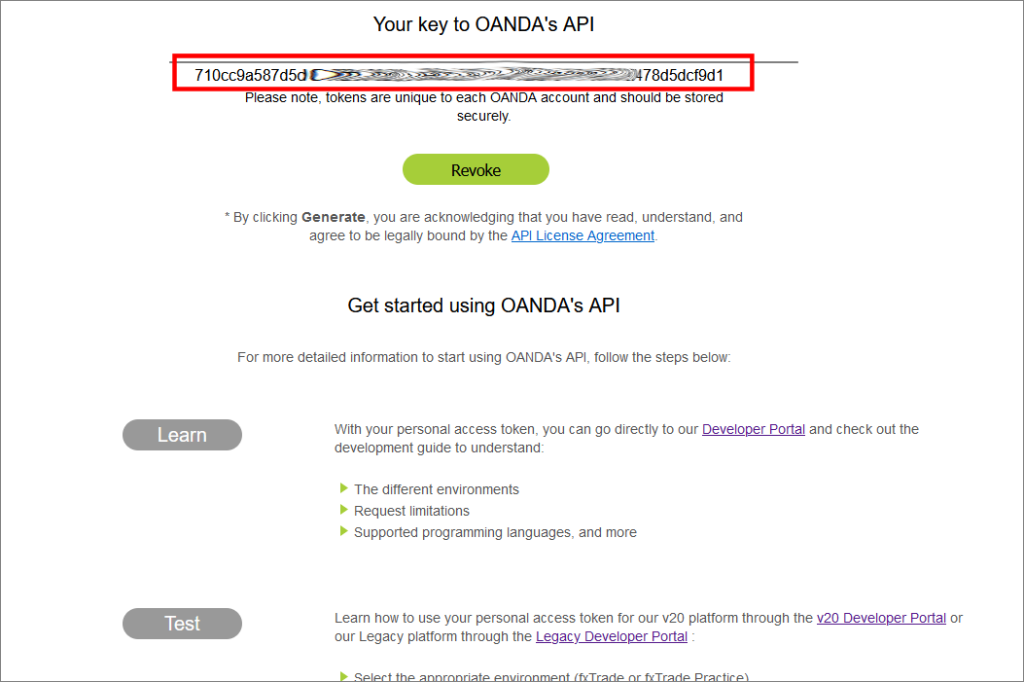
4. Generate your API key (token) by clicking on Generate and copy it taking care NOT to copy spaces or other characters not belonging to the token (if token is incorrect you will not be able to connect to Oanda from Overcharts):


If you have forgotten or lost your API key (token), you can create a new one at any time by clicking on Revoke button and then Generate.
5. Once you have generated and copied your API key (token), proceed with the connection configuration on Overcharts:
- Start Overcharts and select Oanda connection from Connections tab of the Overcharts main window. Access connection configuration window by right-clicking > Edit. If you already have a Oanda connection configured, create a new one.
- Token: enter (pasting) the API key (token) you got in step 4 being very careful to copy it correctly without adding spaces or other characters.
- Server: select DEMO if your Oanda account is a DEMO account, or select LIVE if your Oanda account is a REAL account.
- Fill in any other required properties according to your preferences.
- Press OK
6. Once configuration is complete, start the connection by pressing CONNECT button or by double-clicking on the connection. You are connected successfully if dots near the connection are all green.
If, on the other hand, there is at least one red dot, it means that:
- connection configuration parameters are incorrect
- or data-feed is temporarily unavailable
- or data-feed demo (NOT Overcharts!) has expired.
Hover over “i” icon (next to the red dot) to read a more detailed error message.


