

Market Replay provides an advanced simulation and market analysis experience. With Market Replay you can revisit historical market dynamics, gain deeper insight into price behavior, and test your strategies in a risk-free, safe, and endlessly repeatable environment.
By adjusting replay speed, you can accelerate the simulation, saving time compared to normal speed playback and allowing repeated analysis of the same scenarios.
To use Replay you must:
- Have a PROFESSIONAL data feed. Trading is simulated locally while historical data is downloaded from your data feed. To ensure a complete Replay experience, select a professional data feed that provides 1-tick historical data, CRUCIAL for achieving a replay as faithful to reality as possible. Refer to this documentation for guidance on choosing the right data feed.
- Set up at least one Simulation Account. Overcharts includes several pre-configured simulation accounts that you can modify or expand to suit your needs.
- Create a Replay Workspace.
During replay, all content in the Replay workspace, including charts, indicators, DOMs, Time & Sales, watchlists, etc., is played simultaneously for a complete, integrated simulation experience.
Create a Market Replay #
In Overcharts, Replay is simply a REPLAY workspace. This means:
- There is no limit to the number of replays you can create and use at once.
- There is no difference in usage between a replay and a REGULAR or SIMULATOR workspace. In other words, you won’t need to learn anything new for using a REPLAY compared to a REGULAR or SIMULATOR workspace, and vice versa.
To create a REPLAY workspace:
- In the Charts & Trading tab of Overcharts’ main window, click the NEW REPLAY button
- Or refer to this documentation
The workspace type appears in the workspace list:
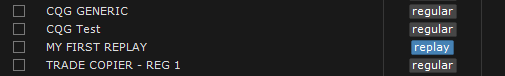
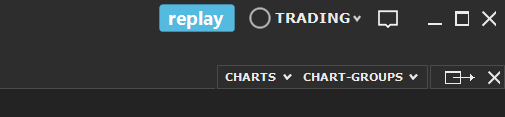
If a workspace is REPLAY type, a replay label is shown at the top right of the workspace window.
Replay Control Bar #
The Replay Control Bar is the main interface for managing market data playback. With this bar you have full control of the Replay experience, allowing you to start, pause, and adjust playback speed, as well as access various additional settings.

From the bar you can:
- Customize replay settings.
- Select the start date and time to launch Replay from a specific moment.
- Download market data.
- Start and pause playback to analyze market movements in detail.
- Adjust Replay speed, speeding up or slowing down playback based on your needs.
- Skip ahead by x minutes during Replay.
- Refresh the entire workspace.
Hot Keys
You can use Hot-Keys to quickly execute main commands like Play / Pause, Stop, and adjust playback speed up or down. This feature lets you manage Replay efficiently without always relying on the mouse. Configure Hot Keys from Overcharts’ main window: refer to this documentation.
Settings #
To access settings, click on the gear-shaped button in the Replay control bar. From here you can customize various options and configure playback according to your needs.
General
- Replay Mode: Two available modes:
- Tick-By-Tick: This mode offers highest accuracy since it uses real tick-by-tick data, actual trades executed, to simulate a live market. This approach guarantees extremely faithful reproduction of market dynamics, allowing you to analyze each movement and accurately assess impact of your strategies.
- Minute-By-Minute: This mode uses 1-minute data to simulate live conditions. For each minute, four prices are generated: Open, High, Low and Close (or Open, Low, High and Close if open is higher than close). Total minute volume is entirely attributed to close price. This mode is suitable for simplified graphical analysis but should never be used for volume studies or with charts having Tick, Contract, or Point resolutions. Time & Sales windows also become meaningless in this mode.
Tick-By-Tick replay is available exclusively with professional data feeds such as CQG, Rithmic, dxFeed. For data feeds like Interactive Brokers (IB), TradeStation, OANDA, etc., replay is limited to Minute-By-Minute. For more information on data feeds, refer to this Documentation.
Historical bid/ask data is not available; therefore, best bid/ask are always calculated based on tick aggressor, that is, based on side (bid or ask) where tick executed. In absence of this information, tick price direction relative to the previous one is used. Quantity displayed in bid/ask is fixed and fictitious.
- Replay Speed: Defines playback speed. Normal speed is 1x, but you can increase up to 1000x or decrease to 0.1x.
- Jump Forward (minutes): Specifies number of minutes to skip forward in replay when corresponding button is pressed.
Date Range
- Time Zone: Defines time zone in which initial date/time and current date/time (displayed in the replay control bar) are shown. If replay starts from a chart, it is automatically set using default instrument time zone.
- Session: Replay session represents market trading hours and is used only to determine whether current date/time falls within trading hours. This allows the system to automatically skip periods when market is closed. If replay starts from a chart, it is automatically set using default instrument session.
- Start Date/Time: Defines replay start date/time.
- Use a Specific End Date/Time: Select this option to set a specific end date/time for replay. If not selected, replay end date/time will be current PC date/time when playback begins.
Data
- Download Data Before Starting: If selected, a data check is performed and, if data is missing, necessary data will be downloaded before replay starts.
- Use DOM Data (if available): If selected, DOM (Depth Of Market) data stored in local database is used during replay. Otherwise, only best bid/ask data is used. If DOM data is not available in the local database for a given period, then DOM, Market Depth Map, Advanced Columns and all indicators or tools that rely on DOM data will not function for that period.
If this option is selected but DOM data is not replayed, it simply means that for that instrument and specific period, DOM data is absent in the local database.
DOM data is not provided directly by data feeds. The only way to have historical DOM data is to save it in real time as it is received during market sessions. To store DOM data in the local database, enable saving in instrument settings. Follow instructions in this Documentation to enable this feature.
Drawings
- Clear Drawings on Replay Start: If selected, all drawings created during a previous replay session will be cleared when a new replay starts.
- Clear Shared Drawings: If selected, all drawings created in a previous replay session and shared among multiple charts in a replay workspace will be cleared when a new replay starts.
Start Replay #
To start Replay, follow these steps:
- Set the start date/time for playback.
- If necessary, in Replay properties, set the end date/time (see Settings above). If not set, the end date/time defaults to the PC’s current time.
- Press Play to begin Replay from the chosen moment.
Alternatively, you can set the start date/time and launch Replay directly from a chart:
- Right-click on the chart window > select ‘Replay: Set as start point and Play‘ to set the start date/time and immediately begin Replay.
- Right-click on the chart window > select ‘Replay: Set as start point‘ to set the start date/time.
Similarly, set the end date/time:
- Right-click on the chart window > select ‘Replay: Set as end point‘.
This mode offers greater flexibility by allowing you to control the simulation directly from the chart without having to use the Replay Control Bar.
The Replay Control Bar displays progress via a progress bar and shows the current date/time in the Replay’s reference time zone defined in settings.
Automatic Data Download #
When you press Play, the system immediately starts playback. If automatic data download is enabled in settings, a check runs before simulation begins to verify market data presence in the local database.
- If data are available, playback starts without further action.
- If data are missing, an automatic download from your data-feed will start before Replay begins. The period checked, and if necessary, downloaded, extends from Replay’s start date to Replay’s end date. Note that data-feeds must be connected; otherwise, no data will be downloaded.
This process ensures the simulation always uses the most complete and accurate data, avoiding interruptions or gaps in playback (unless data are not available from the data-feed).
WARNING!
– Downloaded data include only Trade data. Historical Bid/Ask or DOM (Depth Of Market) data are NEVER downloaded.
– Data for various instruments are downloaded sequentially. This means instruments updated first might be slightly less current than those updated later. The time difference is usually a few seconds or minutes, depending on the data volume and number of instruments.
Manual Data Download #
From settings (accessible via the gear icon on the Replay Control Bar), you can disable the automatic data download at Replay start and choose to download data manually when needed.
Manual download is also useful when the automatic process fails to retrieve all necessary data. It forces the download for an entire date range, even if data for that period already exist in the local database. Of course, data must be available on the Data-Feed; otherwise, nothing will be downloaded.
WARNING!
– Downloaded data include only Trade data. Historical Bid/Ask or DOM data are NEVER downloaded.
– Data for various instruments are downloaded sequentially. This means instruments updated first might be slightly less current than those updated later. The time difference is usually a few seconds or minutes, depending on the data volume and number of instruments.
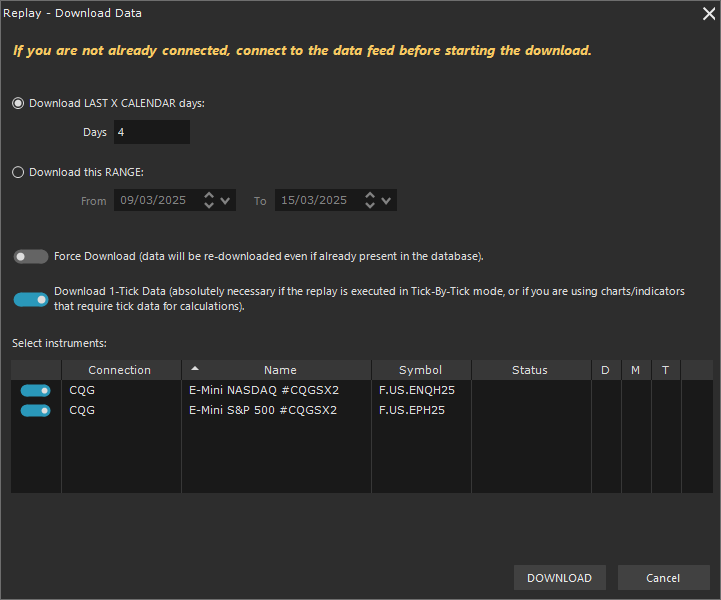
To manually start the download, follow these steps:
- Press Download Data button on the Replay Control Bar.
- Choose the period to download: either select a number of days backward from the current date/time or specify an exact date range.
- Force download (ONLY IF REALLY NECESSARY!): You can choose to force data download even if they are already present in the local database. Select this option only if data are not being downloaded normally.
- Choose whether to download historical 1-tick data. 1-tick data are REQUIRED for Tick-By-Tick Replay mode or for calculating most volume indicators such as Volume Profile, Volume Ladder, TPO Profile, Volume Delta, etc.
- Select instruments to download: instruments listed are all those present in the workspace.
- Press Download.
Data for all selected instruments will download sequentially.
Pause Replay #
Pressing the Pause button on the Replay control bar stops playback at any moment, allowing closer market analysis. To resume, simply press the Play button again.
Stop Replay #
Pressing the Stop button on the Replay control bar permanently ends playback.
Replay Speed #
You can change playback speed at any time, even during playback. To adjust speed, select the desired value from the combo-box in the Replay control bar or settings. Normal speed is 1x, but you can increase it up to 1000x or decrease it to 0.1x.
However, note that the trading simulator, Trading Systems, and some indicators use only current price. This means that if playback runs faster than normal, the simulator may not execute orders at the expected moment, or may not execute them at all. Additionally, Trading Systems (if generating multiple orders/signals within the same bar) might not produce all signals, or may generate them at a different price. Indicators such as Market Depth Map might not be calculated ideally.
It is therefore recommended, when using the trading simulator, Trading Systems, or specific indicators, to maintain normal or moderately low playback speed.
Simulated Trading #
Replay comes with the same trading simulator found in Simulator workspaces. This enables trading during Replay as if in real time, allowing you to refine your strategies risk-free by repeating the experience multiple times.
- All orders entered in a Replay workspace are NEVER sent to your broker, they are executed locally by Overcharts.
- At the start of Replay, any orders and positions from previous replay sessions will be reset, and simulation account balances will return to their initial state.
Simulated trading works best when Replay is run at normal (1x) or near-normal speed. This limitation arises because current data (Last, Bid, Ask) used by the simulator for order control can be much more up-to-date than what is displayed on the chart when playback is too fast. As a result, during high-speed Replay, orders may execute at values different from those expected.
To ensure accurate simulation and proper order execution, it is strongly recommended to run Replay at normal or moderately low speed.
Warnings #
Limitations of Minute-by-Minute Replay #
- Minute-by-Minute replay mode works well for simplified graphical analysis, but it must not be used for volume studies or when using charts with Tick, Contract, or Point resolution.
- Since ticks are always exactly four per minute, using TickCount (number of ticks) instead of Volume in indicator calculations is not possible.
- The Time & Sales window is irrelevant in this mode.
Reference Session #
The reference session defines market trading hours and automatically skips times when the market is closed (for example, during weekends). Without a reference session, replay would continue “empty” on Saturday and Sunday, without new data until Monday.
When using a reference session, weekends and other non-operating periods are skipped. However, if some charts use sessions different from the reference one, these skips may be imprecise. In such cases, it might be better not to use a reference session.
Limitations of Simulated Trading during Replay #
Simulated trading during replay works correctly only when replay runs at normal speed (1x) or near it. This limitation exists because Last, Bid, and Ask data control order placement.
At very high replay speeds, current data in the simulator (Last / Bid / Ask) can be significantly more updated than what appears on the chart. Consequently, orders executed at speeds above normal may occur at incorrect values and times.
For accurate simulation, it is strongly recommended to run replay at normal speed (1x) or only moderately higher speeds.
Additionally, when a trading system is set to generate multiple signals / orders within the same bar (Intra-Bar) instead of signaling after bar completion, similar issues arise.
Possible Inaccuracies in Charts/Indicators #
Historical DOM data are sampled every 200 milliseconds to store them in a local database. This method is necessary to manage the enormous data volume produced by the DOM; saving the complete dataset would require an impractical amount of disk space and memory.
As a result, some functions that rely on DOM data, such as Advanced Chart Columns (Pulling/Stacking) and Market Depth Map, may not perfectly replicate real-time behavior, although the overall result remains very similar.
It is also important to note that during replay the Market Depth Map and other features like Advanced Chart Columns might differ from historical loading when replay is executed at high speeds. To achieve realistic results, it is recommended not to exceed a replay speed of 100x and ideally keep it around 10x or less.
Daily Values #
For calculating daily values in DOMs, Time & Sales (T&S), Order Entries, Watchlists, and similar features, 1-Minute data are always used. This prevents OHLC (Open, High, Low, Close) values and Volume from being directly taken from daily data, which could lead to incorrect values from the start of replay.
However, when using 1-Minute data to simulate daily values, note that the total volume calculated might be lower than that reported in the original daily data. This intrinsic limitation is accepted to maintain intraday dynamics.
On charts with a resolution of 1-Day or longer, it is essential to configure the chart correctly to use 1-Minute data for calculations (in the chart settings, set ‘Build Using Time Frame‘ property to 1-Minute). Without this configuration, the starting replay bar may display incorrect OHLC values and Volume, compromising the simulation’s reliability and accuracy.
Drawing Tools #
Drawing tools are reset at the start of replay (if the corresponding option is selected in settings). This means that all drawing tools created during a replay session are deleted when a new replay starts.
Shared drawing tools can only be used within the same Replay Workspace. This ensures coherent tool management across multiple charts in a Replay Workspace. Note that any global drawing tool present in a Regular or Simulator workspace will neither be available nor visible in a Replay workspace. This guarantees each replay session maintains an isolated, clean working environment without interference from tools in other workspace types.
Features Unavailable in Replay #
In a Replay workspace, the following features are not available:
- Trade Copier: Automatic replication of trades on other accounts or instruments is not possible.
- Alerts: cannot be set or managed.


