

Advanced Columns are vertical column indicators synchronized with the window main chart.
Many Advanced Columns are available: DOM Bid/Ask, Cumulative Order Book (COB), Pulling/Stacking, Profit/Loss etc.
Add new Advanced Column to Chart #
You can add a potentially infinite number of Advanced Columns to chart, even the same column multiple times
To add a new Advanced Column to chart, follow these steps:
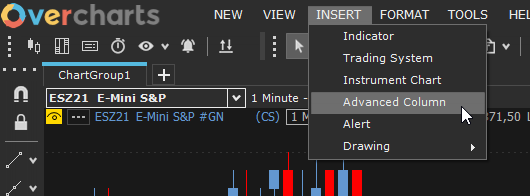
1. From Workspace main menu, select Insert menu item > Advanced Column:
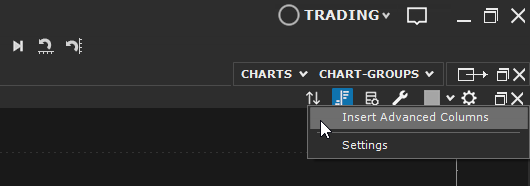
or press Advanced Columns button at the top right of chart window and select Insert Advanced Column menu item:
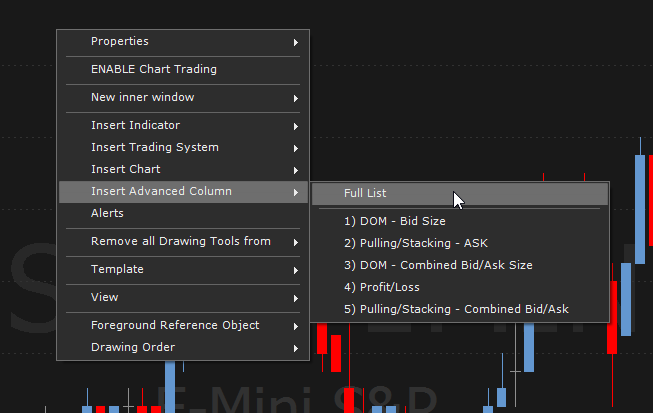
or Right click on chart window > Insert Advanced Column > Full List (or if present, one of menu items corresponding to the recently added Advanced Columns):
2. Select one or more Advanced Columns in the list:
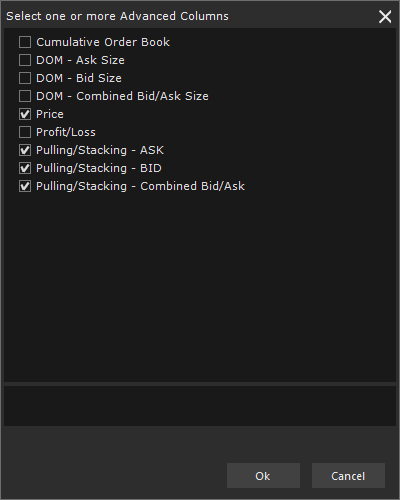
3. Press OK button
4. If necessary, change properties of Advanced Columns you are adding, from the configuration window, then press OK
Remove Advanced Column #
To remove an Advanced Column from chart, follow these steps:
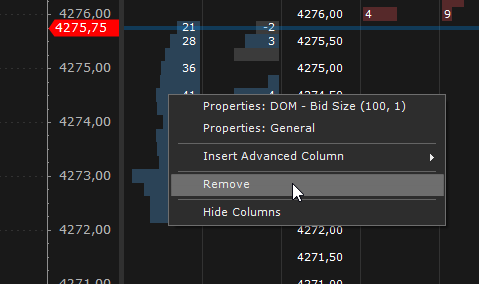
1. Right click on Advanced Column > Remove:
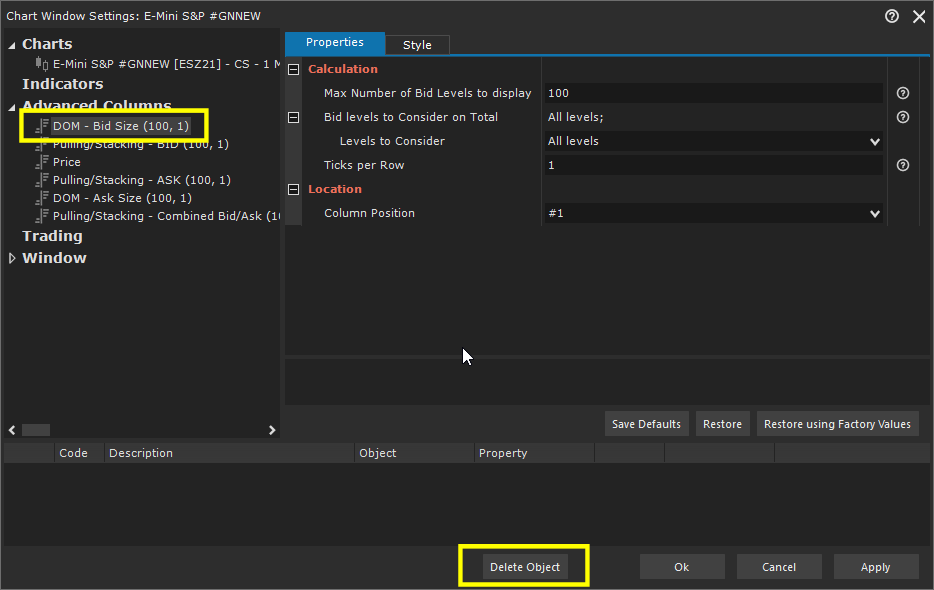
or from chart configuration window, select the Advanced Column and press Delete Object button:
Relocate an Advanced Column #
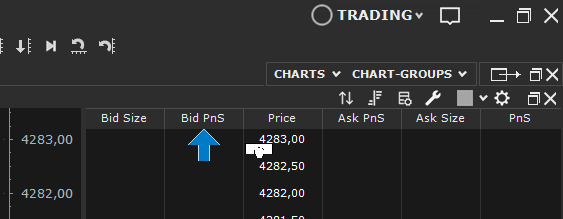
You can relocate an Advanced Column using Drag & Drop (i.e. selecting the column header and dragging it to the right or left while holding down left mouse button and then releasing it once the desired location is reached):
or
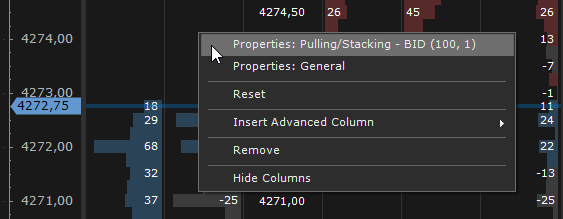
1. Access column configuration by right clicking on column > Properties:
2. Set Column Position property according to your needs
Hide columns WITHOUT removing them #
You can temporarily hide columns WITHOUT removing them and making them visible again in the future, in one of the following ways:
- Right click on any Advanced Column > Hide Columns
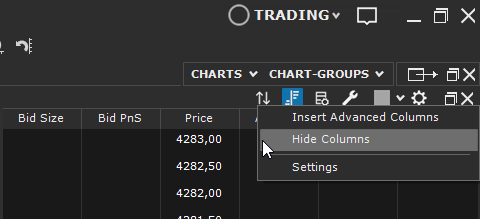
- or press Advanced Columns button at the top right of chart window and select Hide Columns menu item:
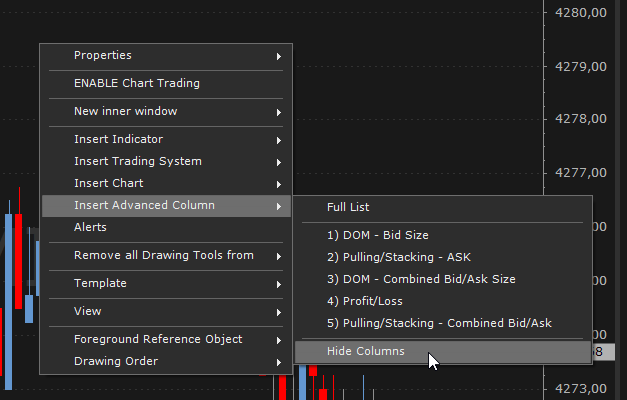
- or Right click on chart > Insert Advanced Column > Hide Columns:
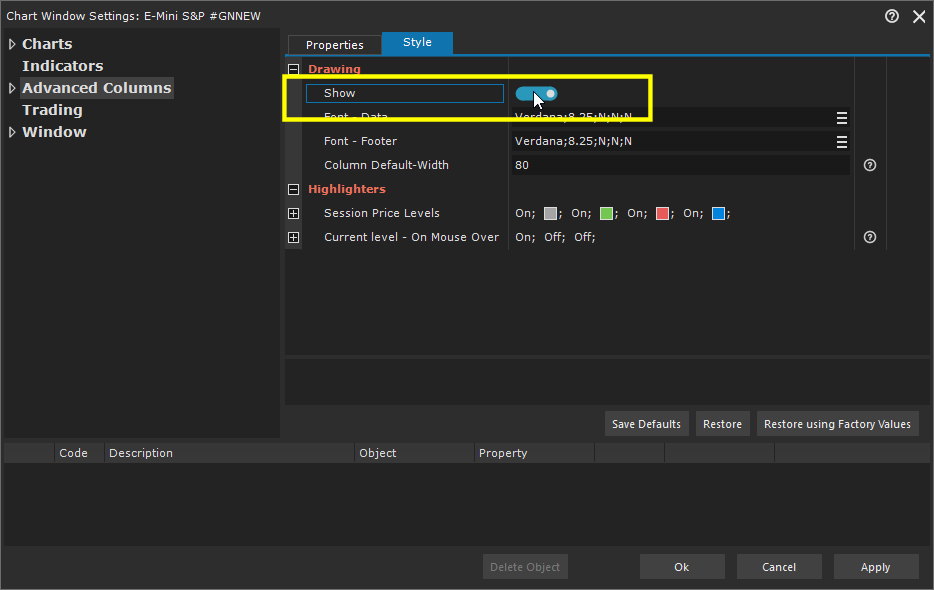
- or from Advanced-Columns general properties by setting Show property:
To show temporarily hidden columns again, do one of previous operations by selecting Show Columns item instead of Hide Columns.
General Properties #
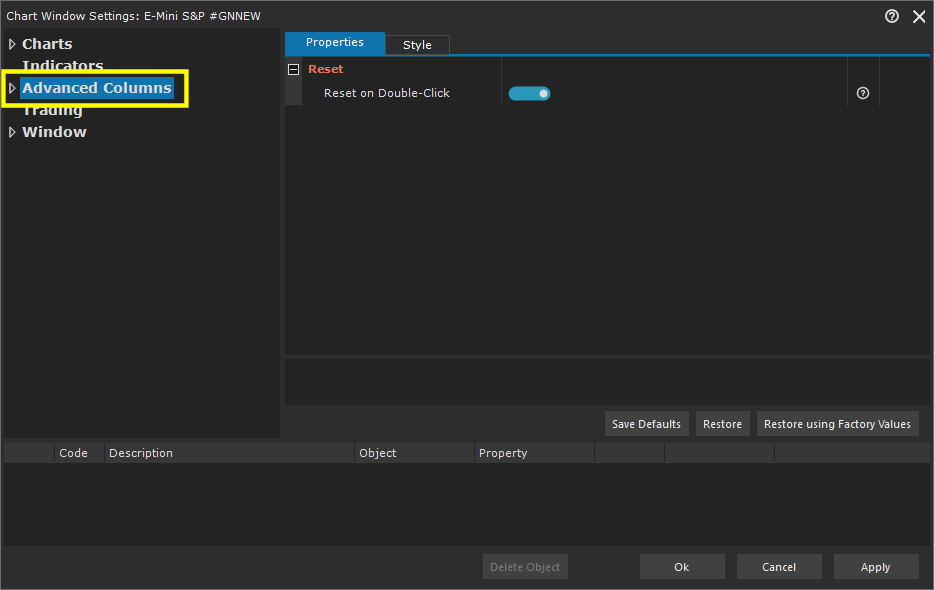
By selecting Advanced Columns in configuration window, you access all Advanced-Columns common properties:
You can quickly access general properties, in one of the following ways:
- Right click on any Advanced Column > Properties: General
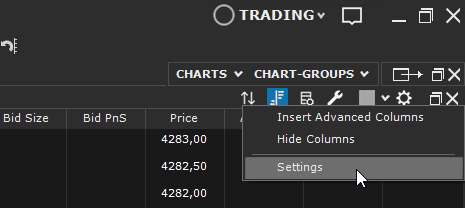
- or press Advanced Columns button at the top right of chart window and select Settings menu item:
Tab Properties > Reset
Reset on Double Click: Allows column reset by double-clicking on it (enabled only for resettable columns)
Tab Style > Drawing
Show: show/hide all columns
Font – Data: specifies which font to use on column data section
Font – Footer: specifies which font to use on column footer section
Column Default-Width: defines default column width when adding new column
Tab Style > Highlighters
Session Price Levels: displays or not Open/High/Low/Close levels of current session within columns
Current level – on mouse over: Highlights price level corresponding to the current mouse position. You can choose whether to display it by hovering the mouse over Advanced Columns, Chart or Order-Entry-Columns (when chart trading is enabled).


