

Volume Profile (Intraday) allows you to build a volume profile every x minutes or bars within a daily session
Click HERE for a general overview of the various types of Volume Profiles available and useful tips
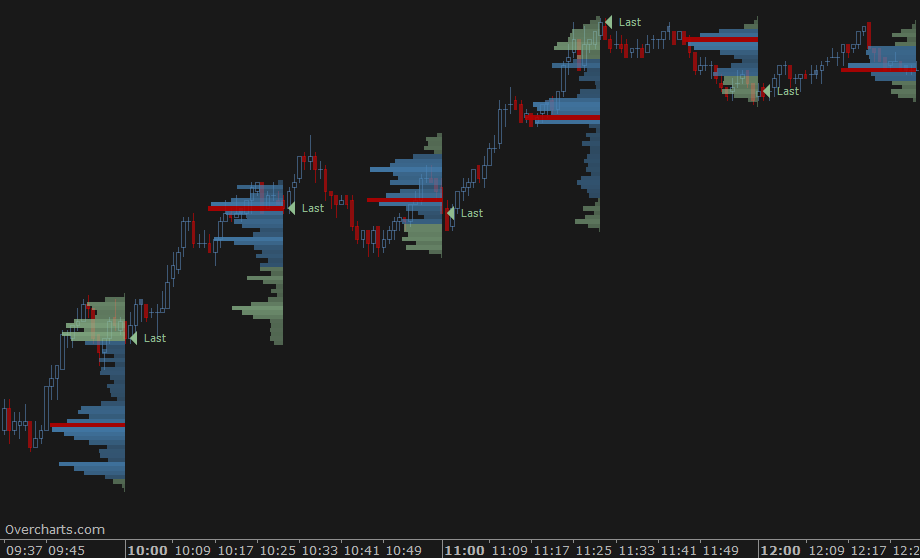
For example, on a 1-minute chart you can build a volume profile every 30 minutes:
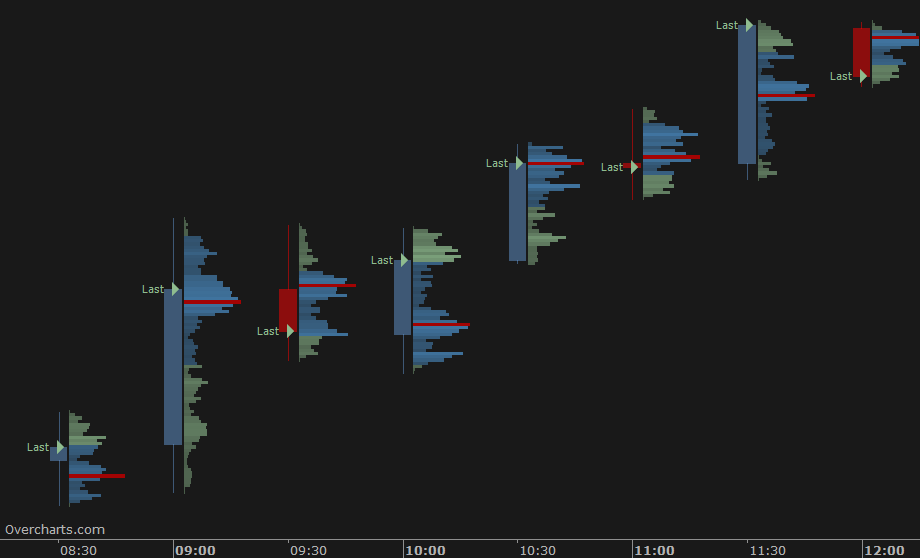
or on a 30-minute chart you can build a volume profile for each bar. In this case, set the space between bars appropriately to optimize the display:
You have infinite combinations between chart and indicator frequency (minutes or bars). The only limitation is that the chart must have an INTRADAY resolution less than or equal to the volume profile frequency. To be clear, you CANNOT build a 30-minute Volume Profile on a 60-minute resolution chart.
Calculation Properties #
You can access calculation properties from the Properties tab in the indicator’s configuration window.
Calculate using: specifies whether to use Volume or Tick Count (number of trades) to calculate the indicator. Unless you have special needs, we recommend you use Volume.
Calculate on Last x Sessions: specifies the number of trading sessions over which the indicator is calculated. If using 1-Tick resolution data to build the indicator, avoid using too many sessions. Data loading and calculation times increase progressively with more sessions. There is no recommended number of sessions; it depends on various factors, especially your PC’s performance, internet connection, and data feed. Set this property according to your needs and PC/data-feed performance. If you notice long loading times, reduce the number of sessions.
Build a new one every: defines the construction frequency of Volume Profile. You can build a new volume profile every x minutes or bars by correctly setting the two properties:
- Frequency: frequency type (minutes or bars)
- Units: number of minutes or bars depending on frequency type
- Break on Session: (visible and usable ONLY with Bars frequency) specifies whether or not to break Volume Profiles series at each new session
Value Area (%): specifies the Value Area width as a percentage. The typical value for this property is 68.2 (default). We recommend not changing it unless you have specific needs.
Ticks per Row: specifies the width (in ticks) of each price level. A tick is the smallest price movement (tick size) defined in the instrument configuration. Typically, the correct value for this property is 1. For some instruments, where the tick size is very small compared to the current price (e.g., U.S. stocks), it may be necessary to group several price levels into one by setting this property to a value greater than 1.
Resolution: defines the resolution of data to be used for calculating the indicator:
- Same as chart: 1-Tick or 1-Minute resolution is used, depending on the chart resolution.
- 1-Tick: (recommended) use this resolution for the highest-definition volume profile. Data loading and calculation times may be long. When resolution is 1-Tick, setting Bid/Ask – Calculation Method allows choosing how volumes of individual ticks are assigned to Bid or Ask:
- Tick Direction: Volume is assigned to Bid or Ask based on direction of the current tick compared to the previous one. In other words, if current tick price is higher than the previous one, volume is assigned to Ask; if lower, it is assigned to Bid. If price is the same, volume is assigned to Bid or Ask based on last assignment made.
- Bid/Ask: Volume is assigned to Bid if the seller is the aggressor, or to Ask if the buyer is the aggressor. If the aggressor is unknown and the price is between Bid and Ask, volume is assigned to Bid or Ask depending on the last assignment made.
- 1-Minute: use this resolution for an approximate volume profile. Data loading and calculation times are very short.
If data resolution is different from 1-Tick, total bar volume is assigned to the price level corresponding to the bar’s close.
In addition to the properties listed here, there are other minor properties or properties that do not require further explanation.
Style Properties #
You can access style properties from the Style tab in the indicator’s configuration window.
NOTE: In addition to style properties listed below, there are other minor or repetitive properties that do not require further explanation.
Volume Profile #
Direction: specifies volume bar direction: from Right to Left or Left to Right.
Position: specifies the volume profile position relative to the time interval on which it is built. You can place the volume profile at the beginning or end of the range (internally or externally). In case of volume profile built on each single bar, an internal position will draw the volume profile to the center of bar, an external position will draw the volume profile on the right or left side of bar.
Width: specifies the width of each volume profile in percentage or pixels. If using a percentage, the volume profile width will be a percentage of the reference area.
Display as: specifies how the volume profile is displayed:
- Volume: Volume bar is colored with a single color. Color varies based on zone to which bar belongs (inside or outside Value Area) and will be more or less intense depending on bar volume and specified opacity (min/max).
You can choose between classic or rounded style and decide whether to draw only border (useful for making volume profile less prominent). - Bid/Ask: Volume bar is divided into two parts of different colors, corresponding to volume generated on BID and volume generated on ASK. This display type requires the use of 1-Tick resolution data to build the indicator.
- VPOC Only: only bar corresponding to VPOC is displayed.
Current Volume Profile (LAST):
You can set a completely different position and style for current volume profile (last) compared to historical volume profiles
LAST – Position: specifies whether to draw the last volume profile inside the chart or on the chart’s right margin. If drawn on the right margin, you can align the volume profile to the right, center, or left of the margin.
Delta Profile #
Delta Profile is often used to complement volume profile and shows delta of each price level. In other words, difference between volumes generated on ASK minus volumes generated on BID.
You can choose to draw Delta Profile along with Volume Profile, as an alternative to Volume Profile, or not draw it. However, to draw Delta Profile, 1-Tick resolution data is required to build the indicator.
If volume profile is visible along with delta profile, some style and position properties are inherited from volume profile.
Direction: specifies bar direction: from Right to Left or Left to Right.
Position: specifies whether to draw Delta Profile on the right, left, or overlaid on the volume profile. If Volume Profile is not visible, it specifies the position of Delta Profile relative to the time interval on which it is based. You can place Delta Profile at the beginning or end of the range (internally or externally). In case of delta profile built on each single bar, an internal position will draw delta profile to the center of bar, an external position will draw delta profile on the right or left side of bar.
Width: specifies the width of each delta profile as a percentage of the total space reserved for volume profile + delta profile. For example, if the total space for volume profile + delta profile is 100 pixels and the width of delta profile is 30%, then the volume profile and delta profile will be 70 and 30 pixels wide, respectively (total space reserved is defined by the volume profile Width property).
If the volume profile is not visible, you can set delta profile width in percentage or pixels. If using a percentage, delta profile width will be a percentage of the delta profile’s reference area.
Current Delta Profile (LAST):
Similar to volume profile, you can set a completely different position and style for the current delta profile (last) compared to historical delta profiles.
Warning: If volume profile is drawn alongside delta profile, some style and position properties are inherited from the volume profile.
VPOC (Volume Point of Control) #
VPOC is the price level with the greatest volume, around which the value area is calculated. Use the properties in this section to draw or not the VPOC and set it according to your needs.
Naked Line: is a horizontal line drawn from VPOC and extended to the end of the chart (right side). The line is drawn ONLY if the price level has not yet been reached by current prices or, more specifically, by subsequent volume profiles.
VPOC Trace Line #
Trace-Line is a broken line showing the VPOC position over time within the period where the volume profile is calculated. Use properties available in this section to draw or not the Trace-Line and set it according to your needs.
Open Gap/Lap #
An Open Gap/Lap represents a Last price level (the last price of a previous volume profile) that has not yet been reached by current prices or, more specifically, by subsequent volume profiles. It is represented by a horizontal line drawn from the previous Last price and extended to the end of the chart (right side).
Labels/Markers/Level Lines #
You can highlight significant price levels such as Open, High, Low, Last, Middle, VPOC, Value Area (high/low), etc. using labels and/or horizontal lines. Configure which levels to display according to your needs using the properties available in this section.
Summary #
You can display summary values at the bottom of each volume profile, such as Total Volume, Total Delta, High/Low Range, and the time interval over which the volume profile is calculated. Configure which summary values to show according to your needs using the properties available in this section.


