VOLUME BUBBLES
Volume Bubbles displays on chart the traded volume. Volume representation takes place through bubbles (dots) of different sizes depending on the represented volume quantity.
This displaying volume method allows you to easily and quickly identify the price levels where the largest trades took place and whether the sellers or buyers predominated.
To form each individual bubble, volume is aggregated using one of the following methods:
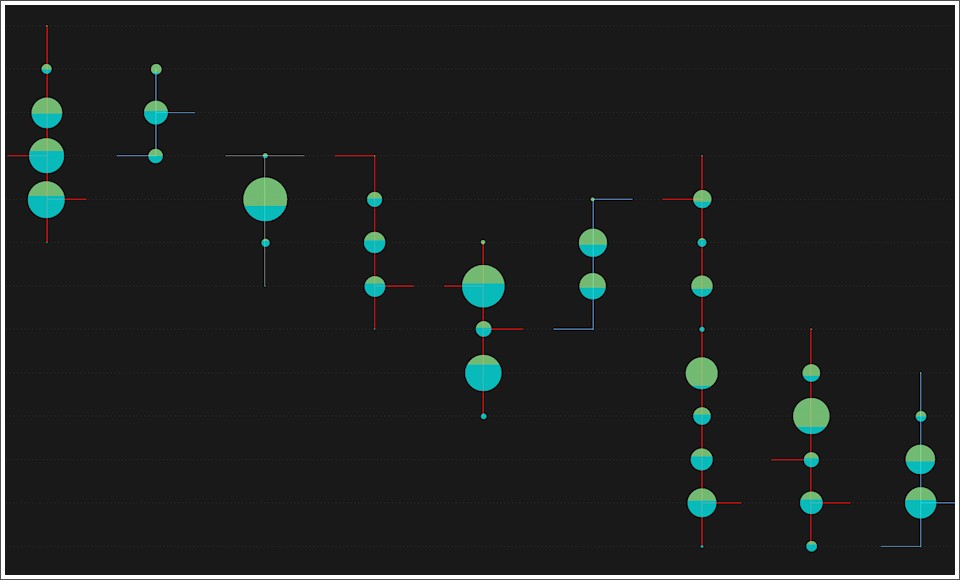
Every Price Level
A bubble is displayed for each price level traded within a single bar. Each bubble represents the total volume traded at that price level in that single bar.
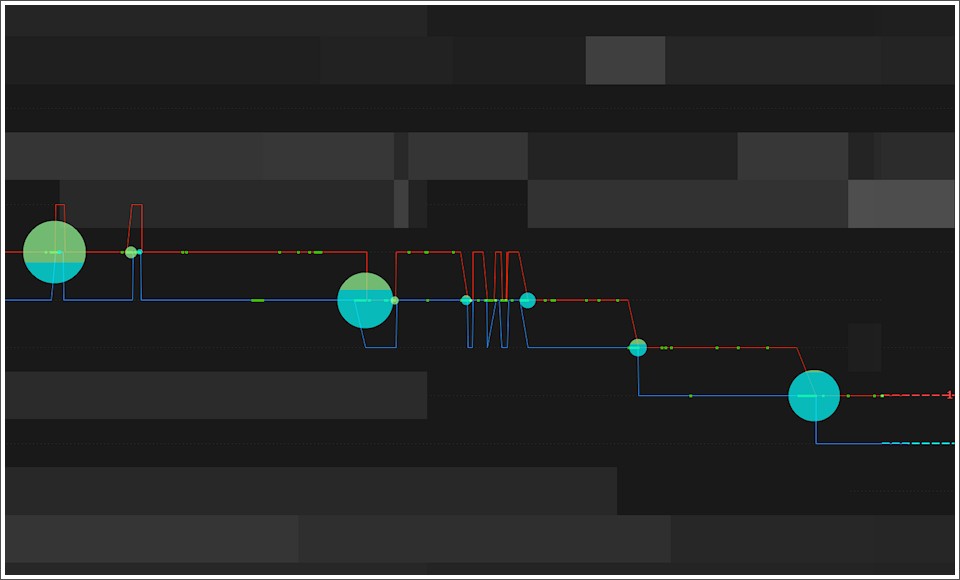
Until bid/ask remain unchanged
Volume will continue to accumulate to form a bubble as long as the bid/ask levels remain unchanged. If the bid or ask price changes, a new bubble will begin to form. The bubble will be plotted on last price.
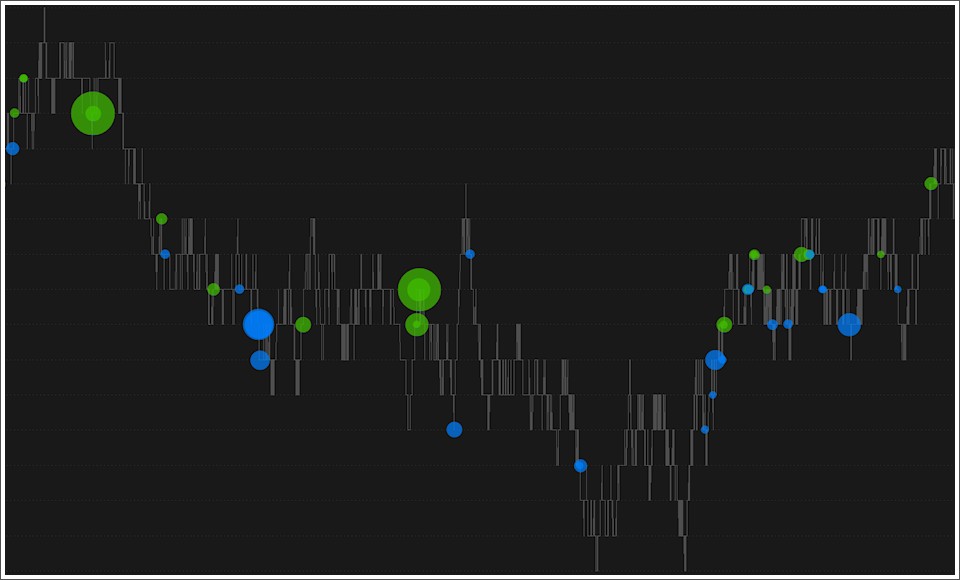
If tick size is Greater or Equal to Minimum Size
A bubble will be plotted for each tick that has a volume equal or greater than the defined minimum value.
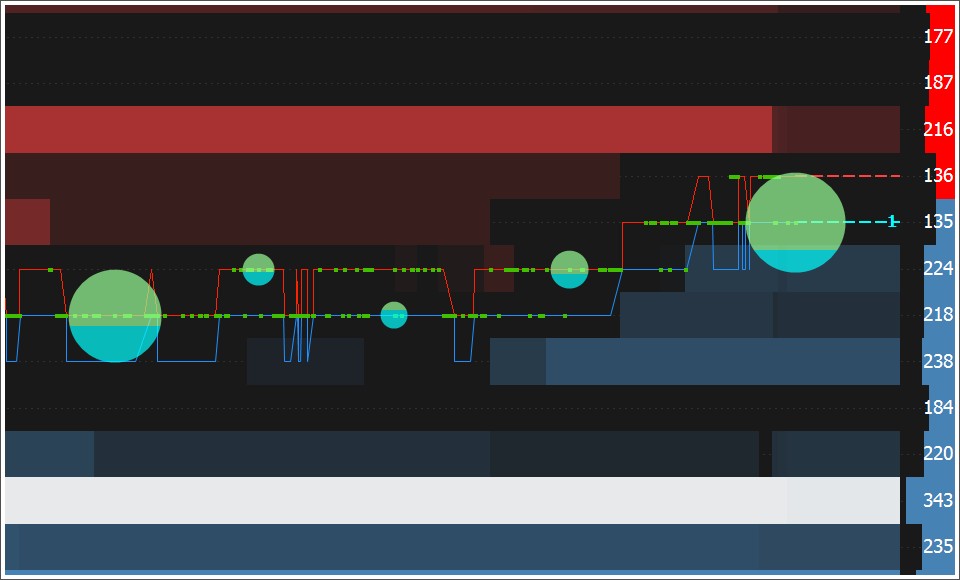
Every x Time
A bubble is displayed every x seconds or minutes and the represented volume will be the total traded volume in that time range. The bubble will be plotted on last price.
Until Volume is Lower or Equal to
A bubble will be drawn upon reaching a certain volume threshold. The volume represented by the individual bubbles will be very similar to each other.
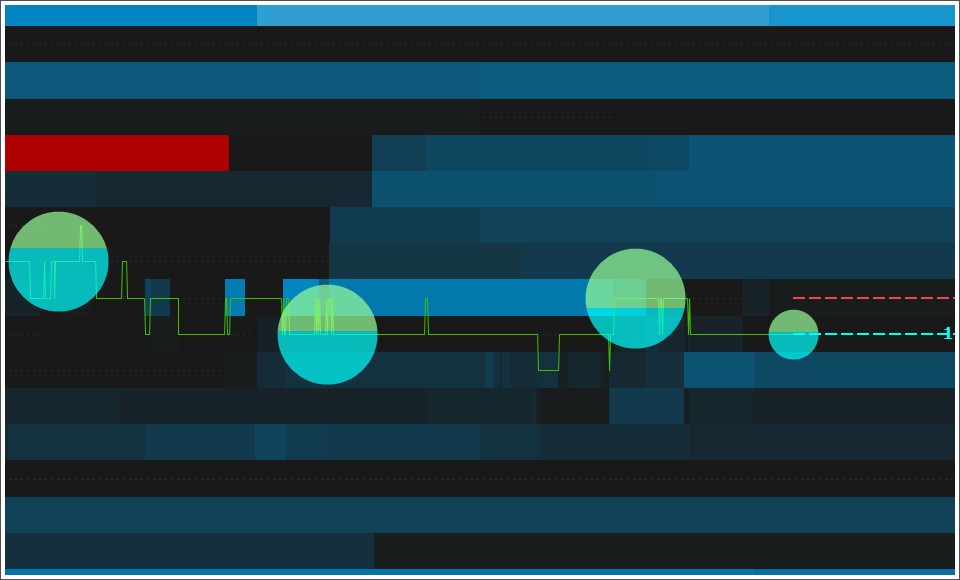
It is possible to define the maximum size (in pixels) of bubble, its transparency, and the bid/ask color.
Two coloring modes:
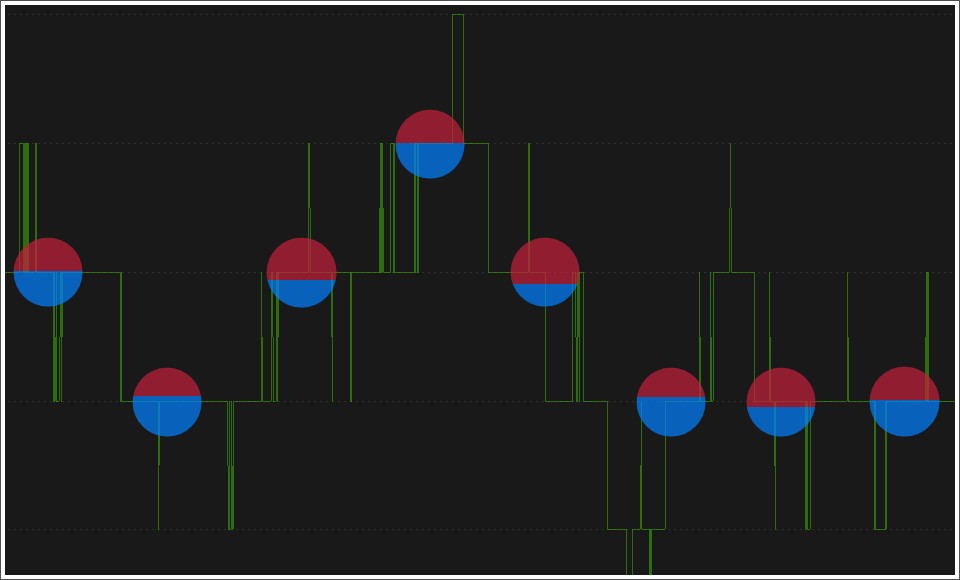
Solid
Bubble is split into two parts and colored using two distinct colors representing the quantity traded on bid and ask.
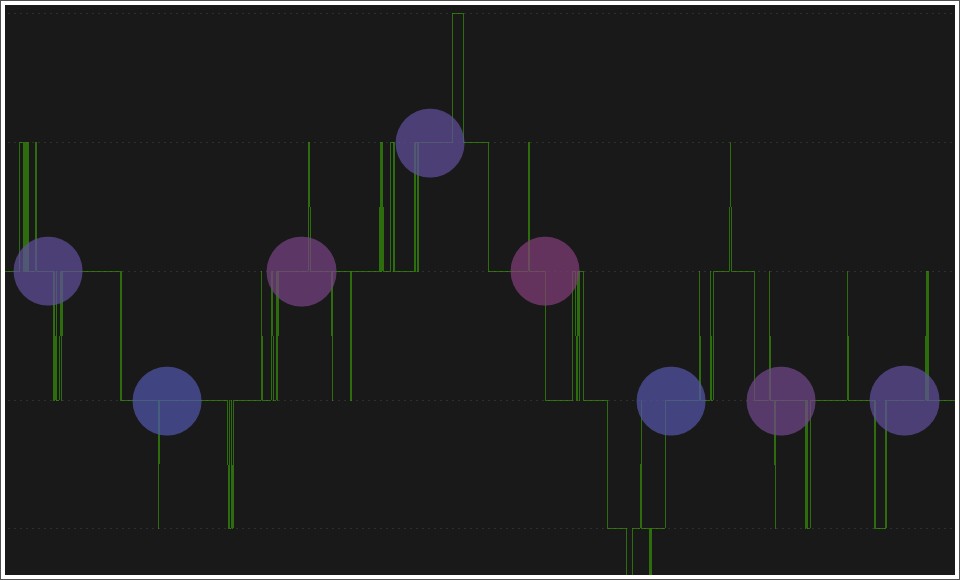
Gradient
Bubble is colored using a bid/ask color scale.
Highlights:
- A maximum of 10 bubbles will be drawn for each individual bar. These bubbles will be the 10 bubbles with the greatest volume.
- A maximum of 1000 bubbles will be drawn on the chart at a time. This means that if in a certain chart zoom there are more than 1000 bubbles to display, only the 1000 bubbles with the greatest volume will be plotted.

