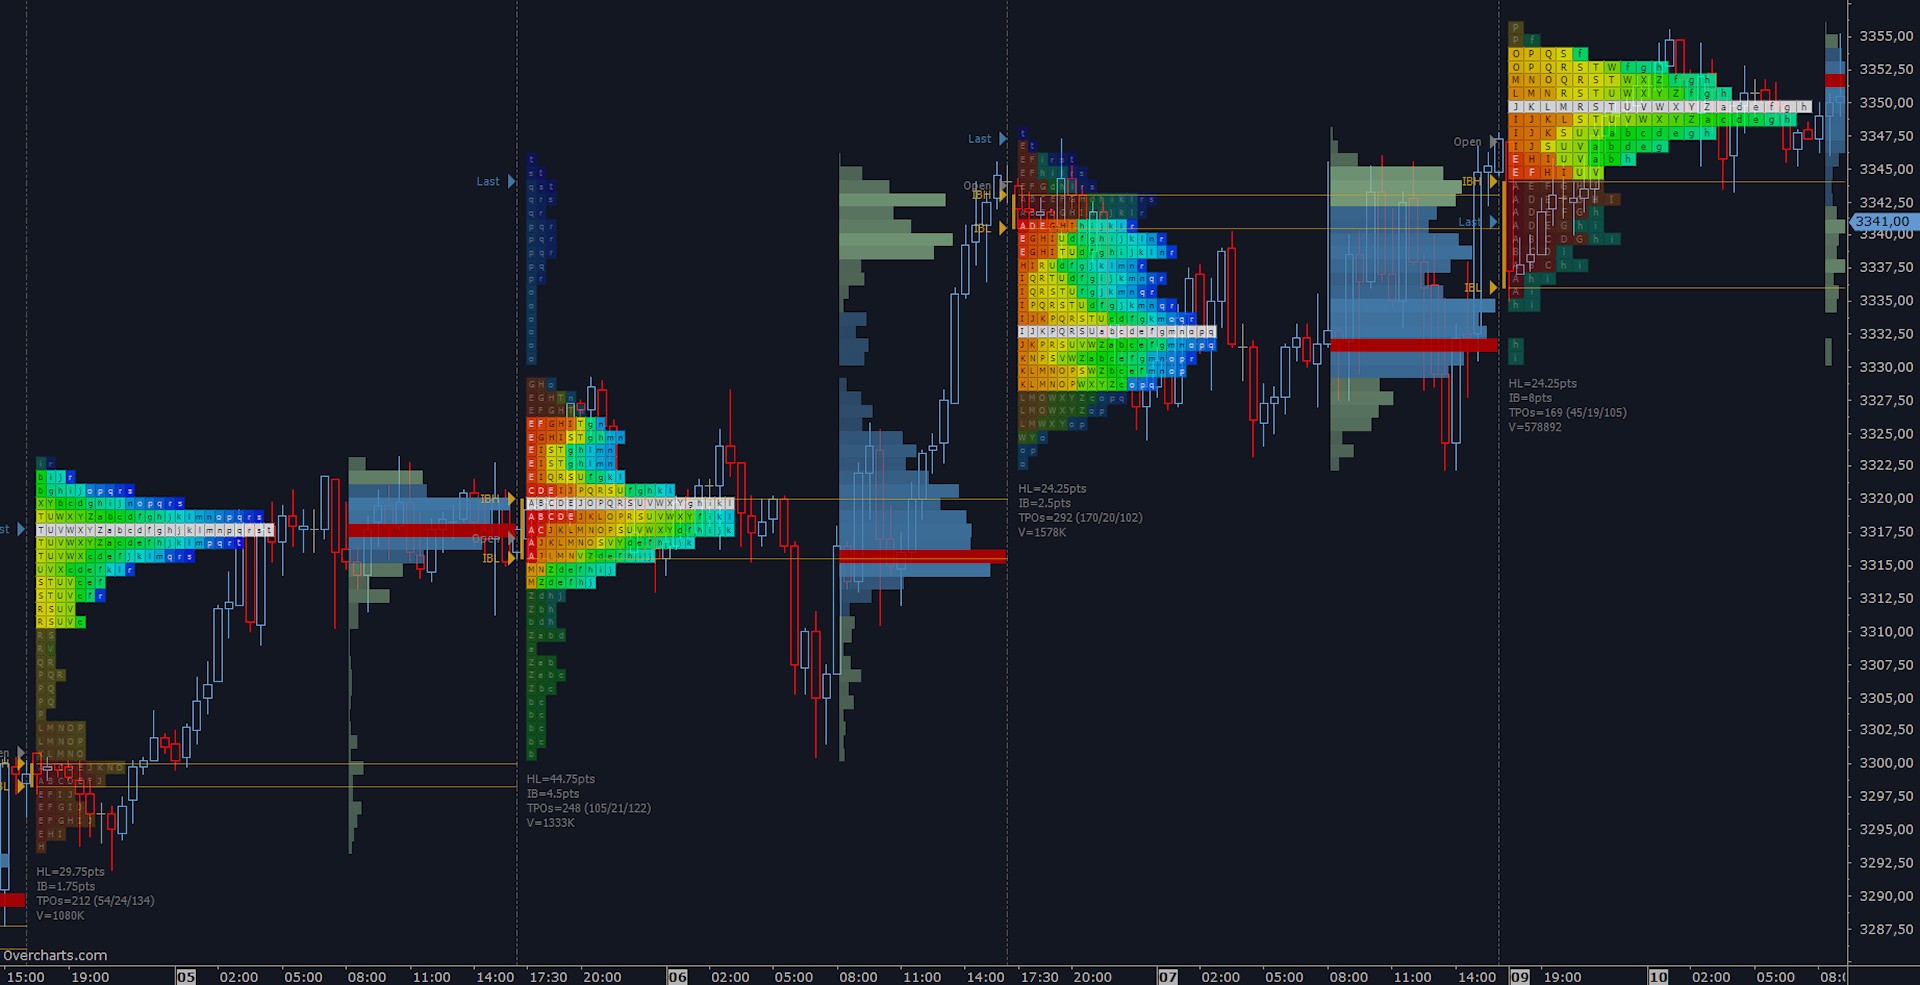
TPO Profile
TPO Profile (a.k.a market profile®), is similar to volume profile. Time-Price-Opportunity (TPO) shows the price distribution during the specified time and highlights at which levels the price has spent the most time.
TPO profile is generally used in conjunction with volume profile to better identify areas of support and resistance.
TPO Profile (Session)
This TPO Profile is built on session (Trading Hours) defined in the reference chart or indicator settings. You can define two different sessions in the same indicator. The TPO Profile of each session is drawn at the beginning/end of session.
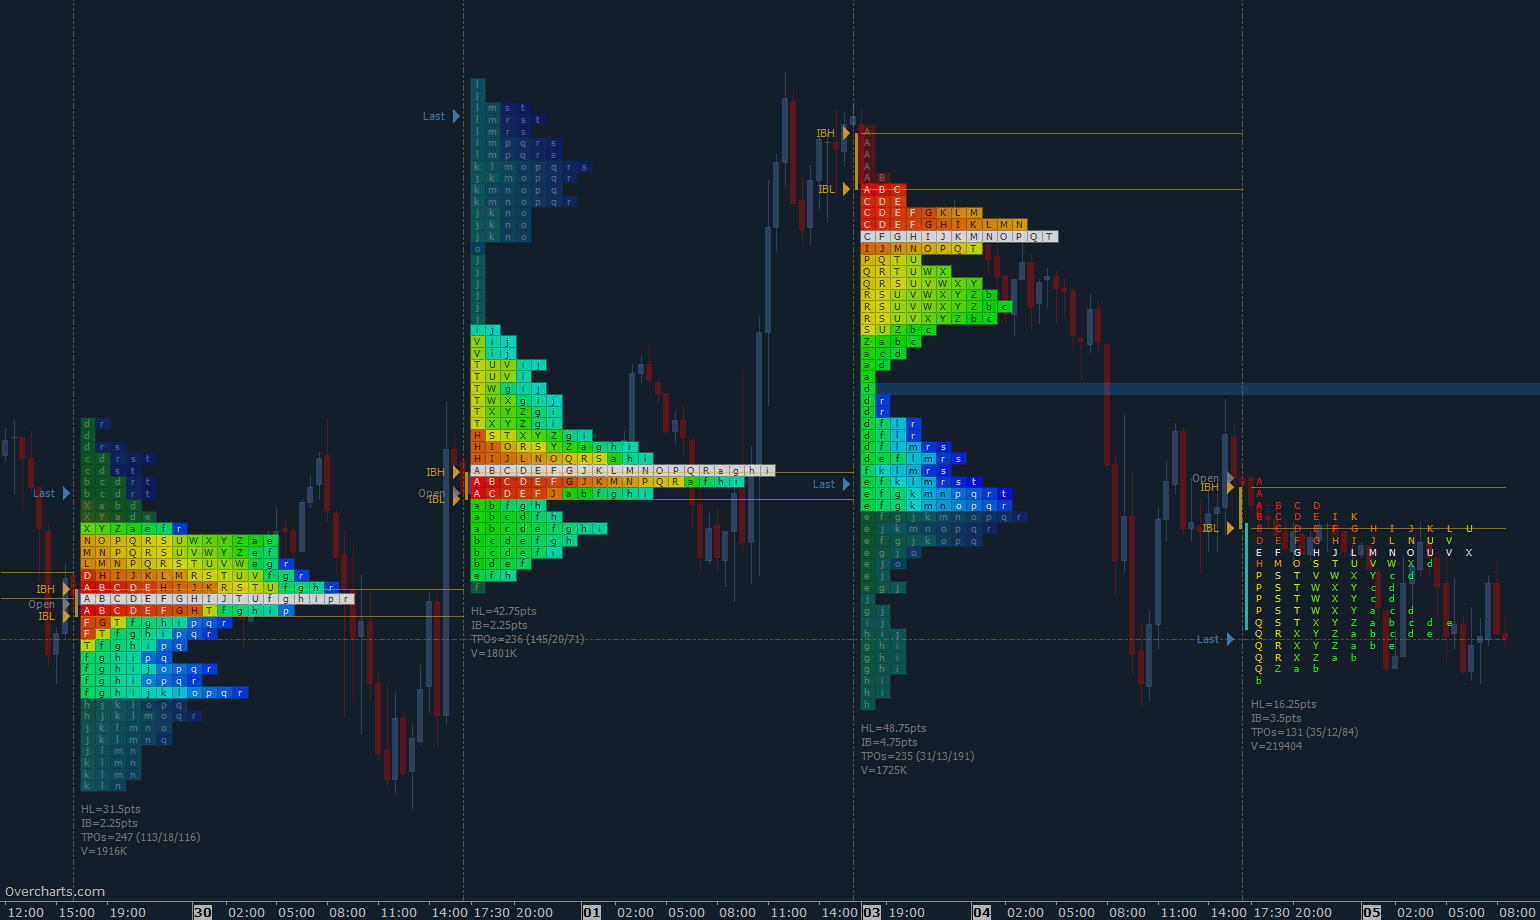
Highlights
Point of Control (POC)
Price level where the greatest market activity occurred.
Letters & Boxes
TPOs can be represented by Letters, Boxes or Letters and Boxes together.
Value Area
Two different display modes:
-
Internal to profile
-
Vertical line outside the profile
Any Chart Type
TPO Profile can be displayed on any chart type, including non-time based charts.
Ticks per Row configurable
The number of price levels per row (TPO) is configurable. Useful for instruments with a small tick size or large session range.
Latest Profile & Historical Profiles style
You can configure the latest TPO-Profile with a completely different style than the historical TPO Profiles.
Initial Balance
Initial Balance interval configurable starting from the beginning of session.
Single Prints
Single-Prints (Singles) are price levels containing only 1 TPOs. They indicate that market has moved too fast in that area and prices will most likely tend to return to those levels in the future.
Other
-
Period Open Price Highlighted
-
Naked POCs
-
Open Gap/Lap
-
Markers & Lines
-
Summary Info
-
… and more
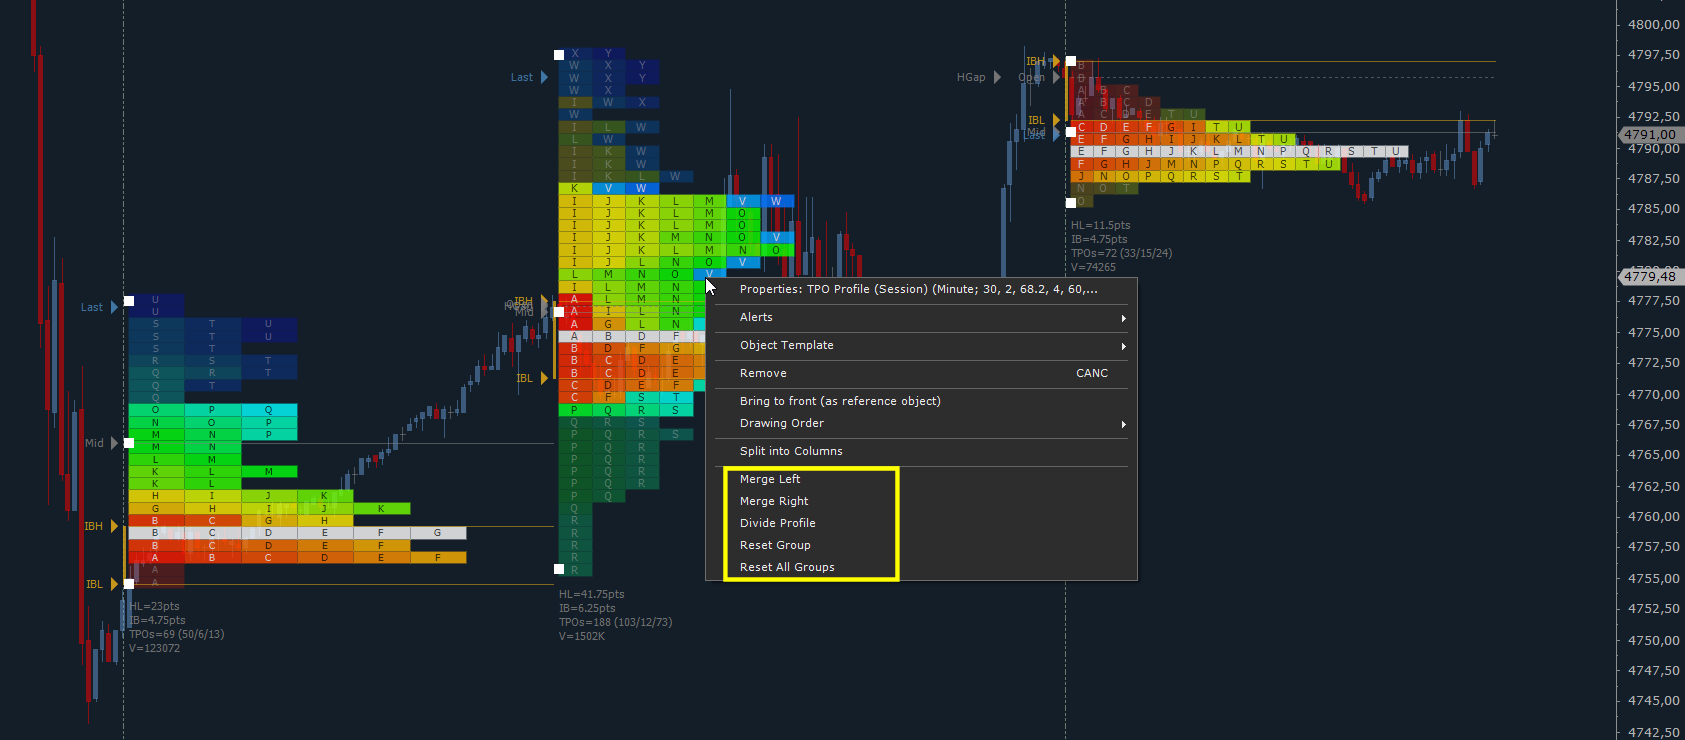
Merge / Divide Profiles
You can merge two adjacent TPO Profiles or divide a single Profile into two parts directly with the mouse on the chart.
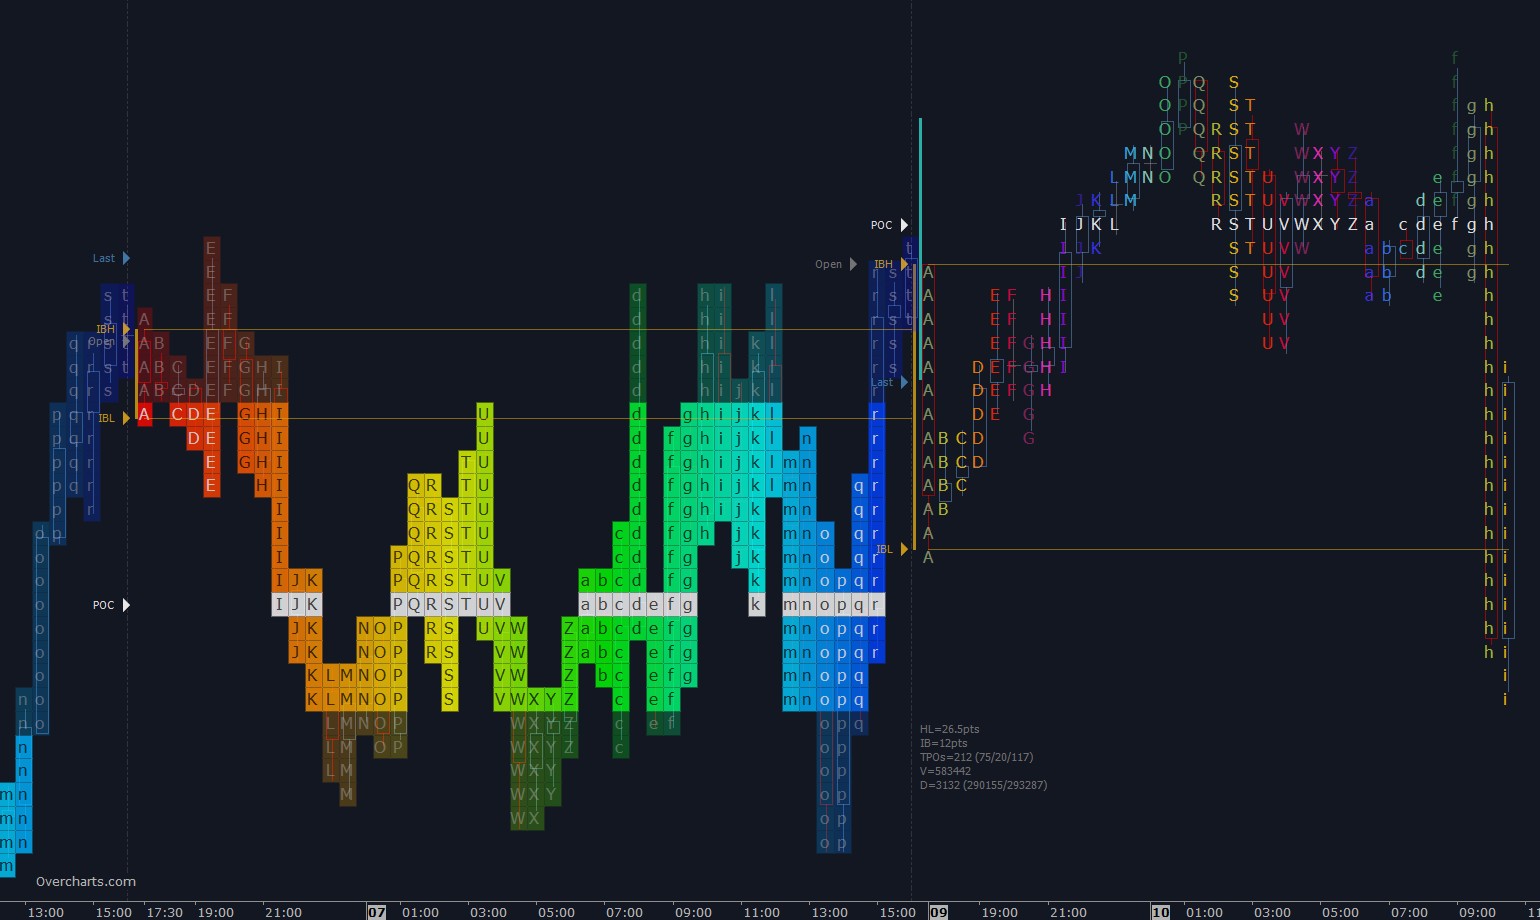
Split into Columns
TPO-Profile can be displayed aggregated or divided into columns corresponding to the defined Time-Bracket. Particularly useful when Time-Bracket and reference chart resolution coincide.
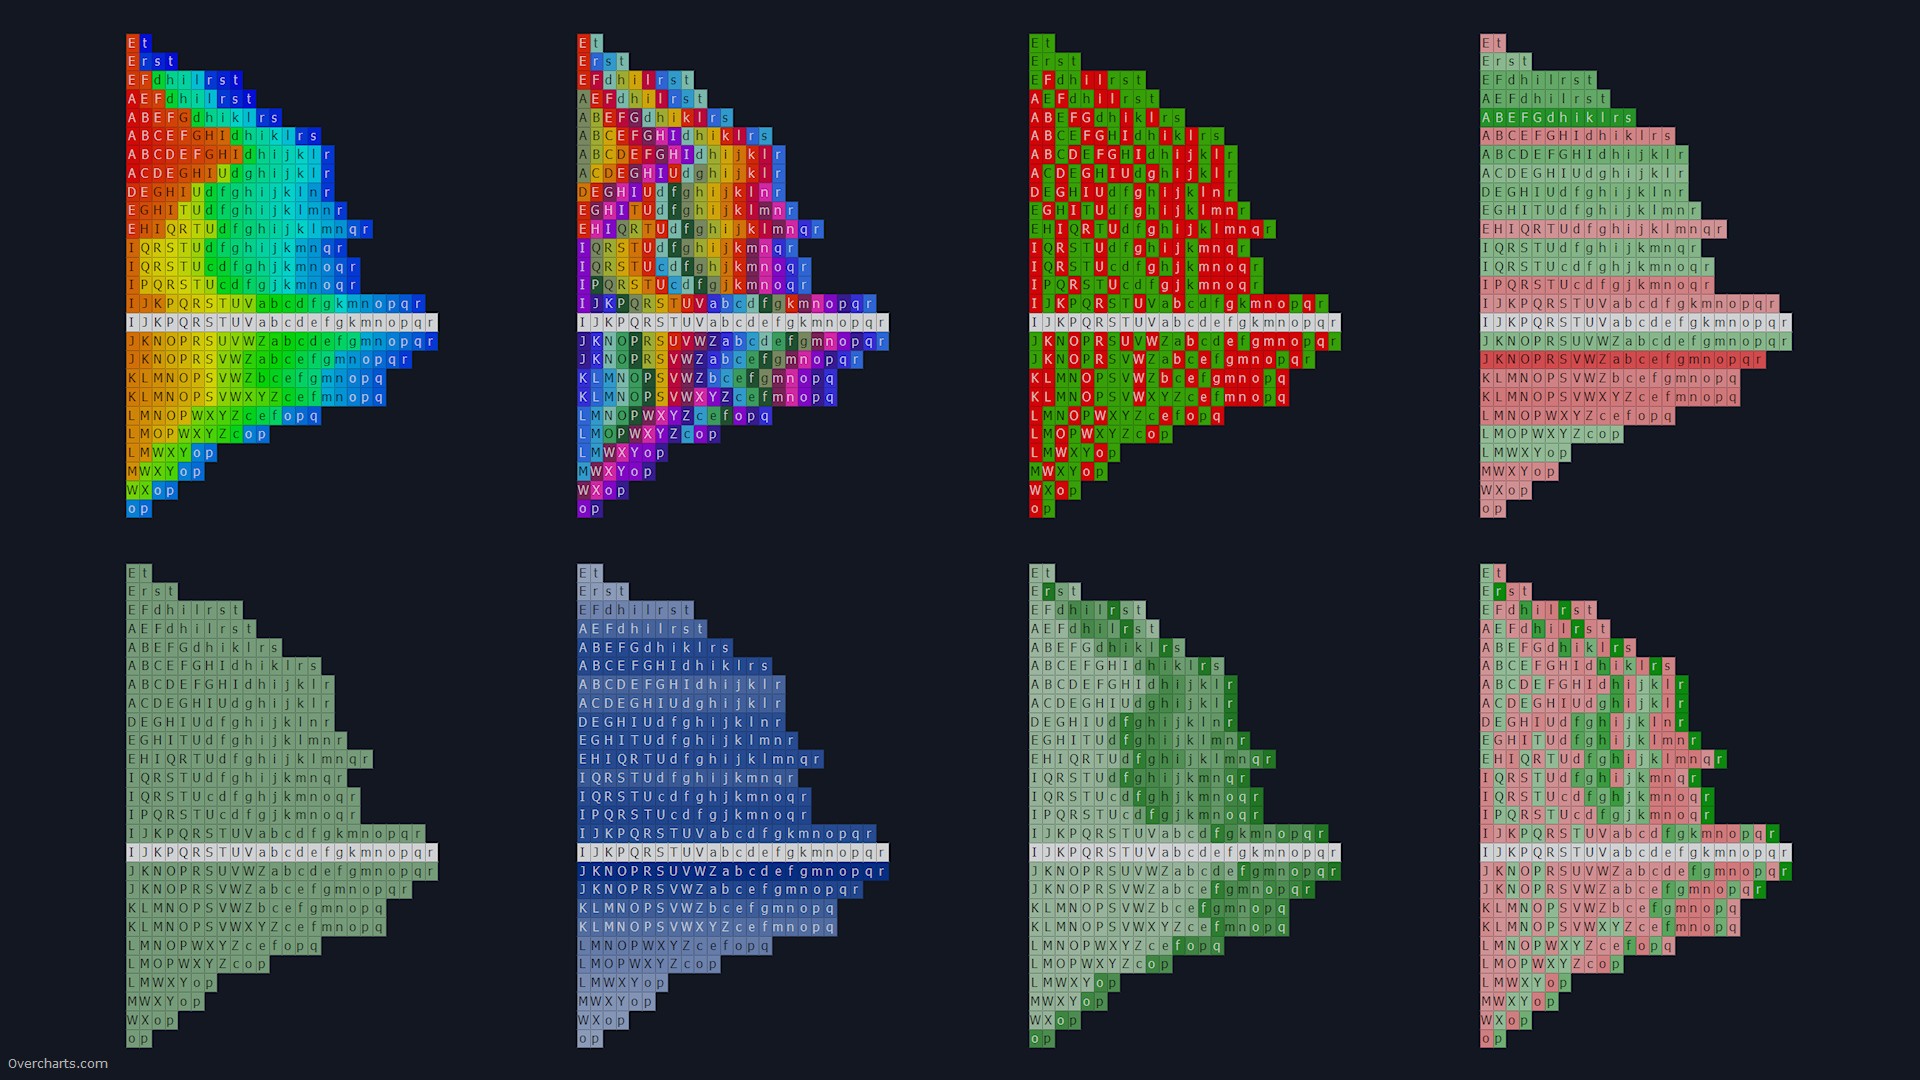
Colors
Choose TPO-Profile color according to the study or information you want to highlight:
Heatmap: TPOs are colored with a different shade based on their position within the trading session (Trading Hours)
Single Color: entire Profile is colored using a single color
Multiple Colors: TPOs take on a different color according to the Time-Bracket they belong
UpDown TPO-Profile: Profile is colored according to the Open/Close values of entire Profile
UpDown Bar-Range: TPOs are colored according to the Open/Close values of Time-Bracket they belong
Volume TPO-Profile: entire Profile is colored according to the profile total-volume in relation to the other TPO-Profiles displayed
Volume Price: Profile is colored according to the volume of each single price level (similar to Volume Profile)
Volume Bar-Range: TPOs are colored according to the volume traded in the Time-Bracket they belong
Delta TPO-Profile: entire Profile is colored according to the profile delta in relation to the other TPO-Profiles displayed
Delta Price: Profile is colored based on delta of each single price level compared with delta of the other price levels (similar to Volume Ladder indicator)
Delta Bar-Range: TPOs are colored according to the delta of Time-Bracket they belong
TPO Profile (Long Term)
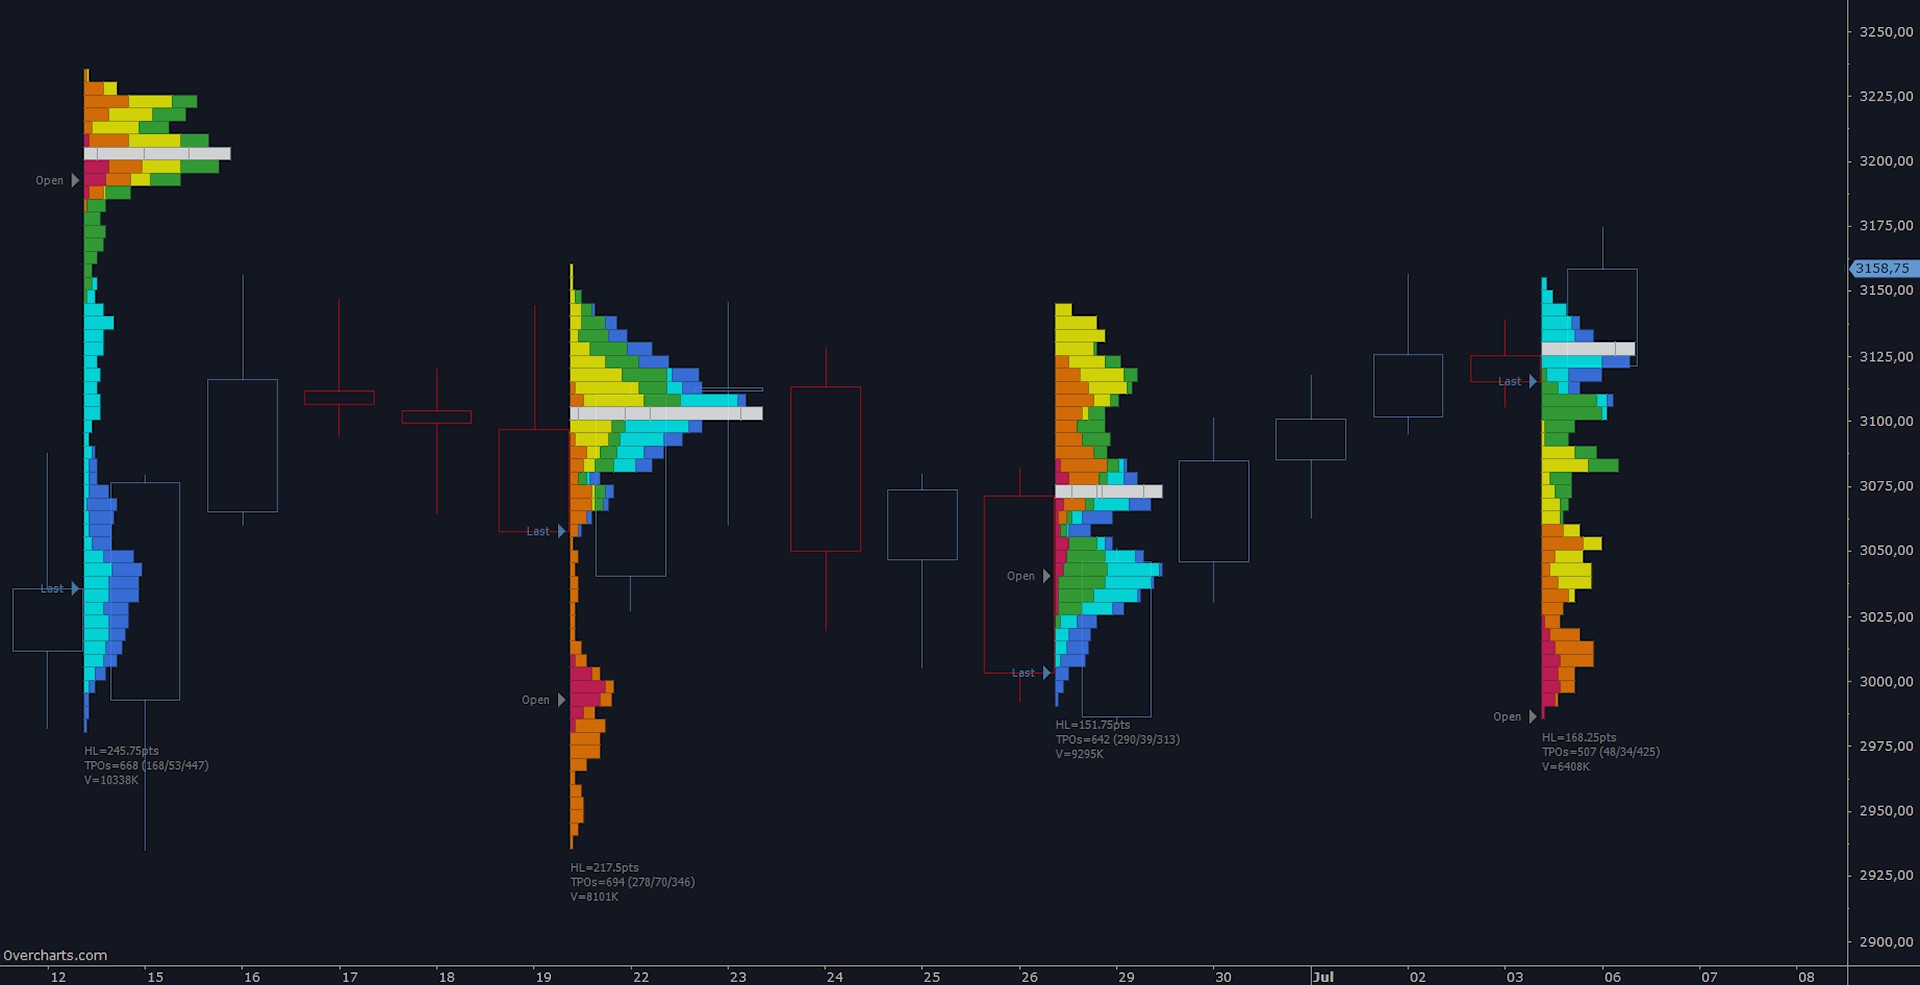
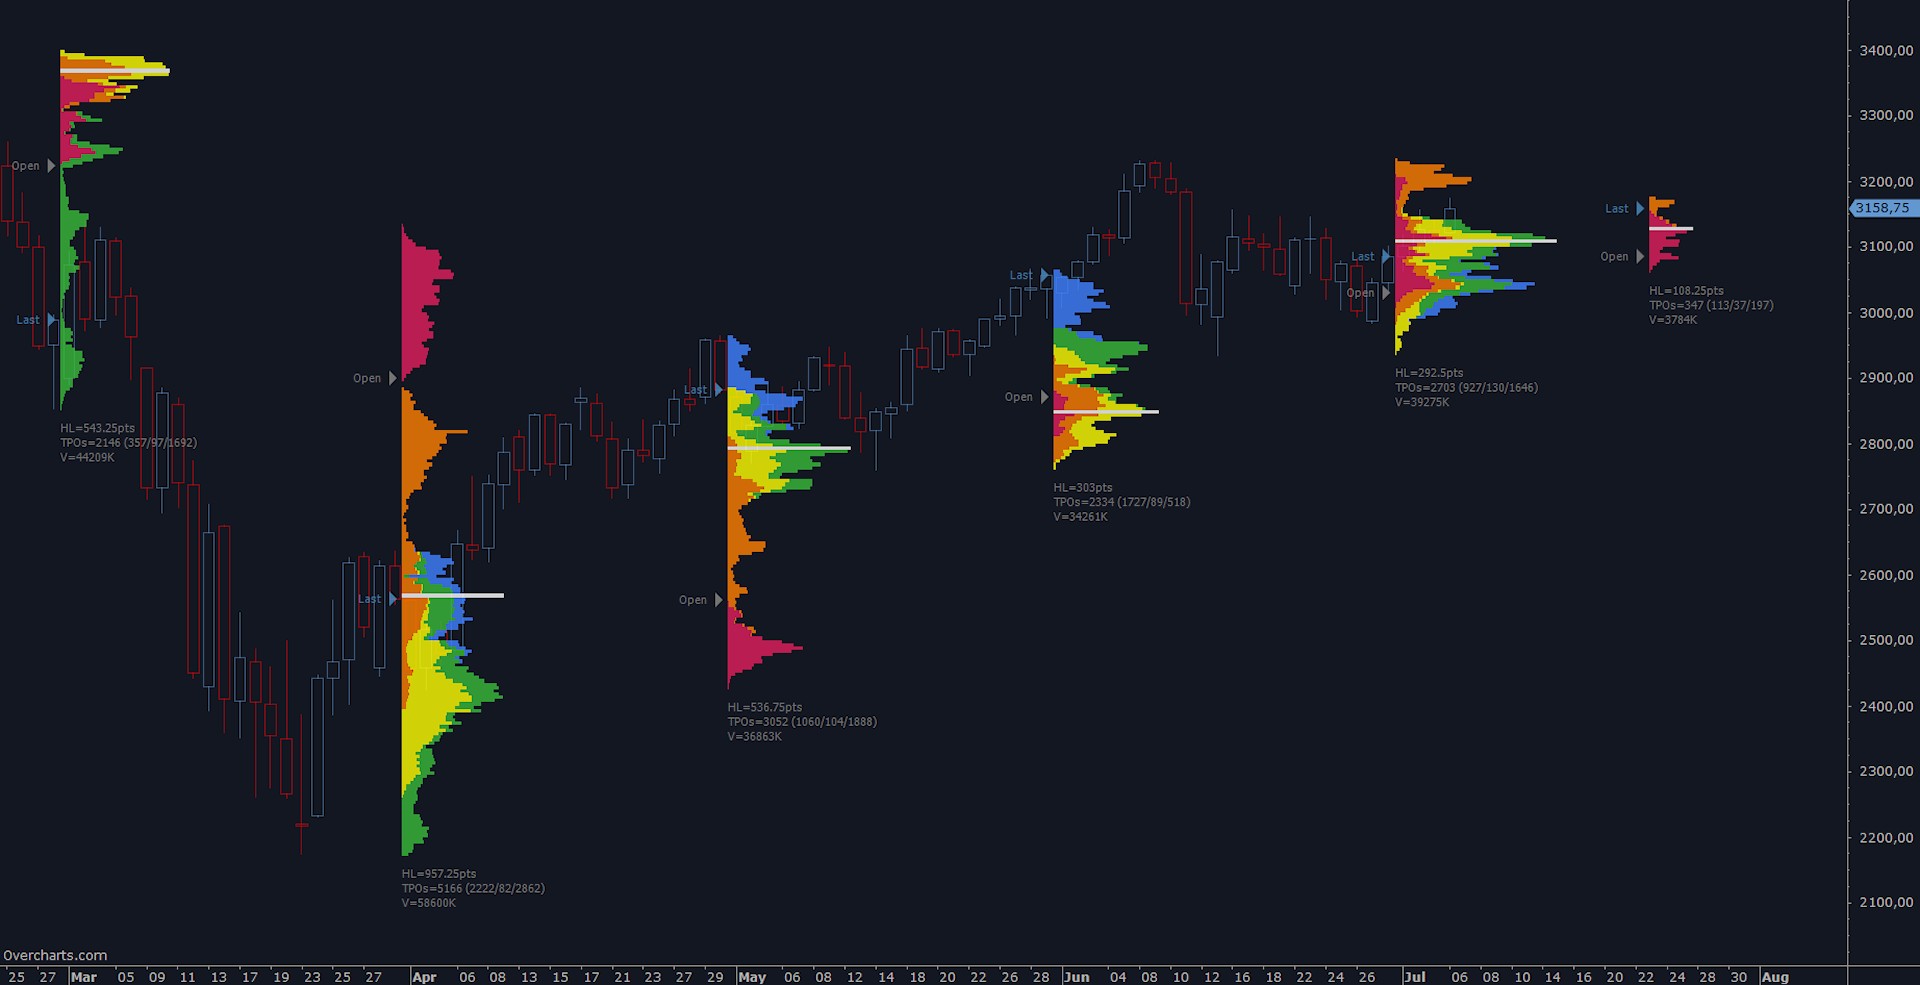
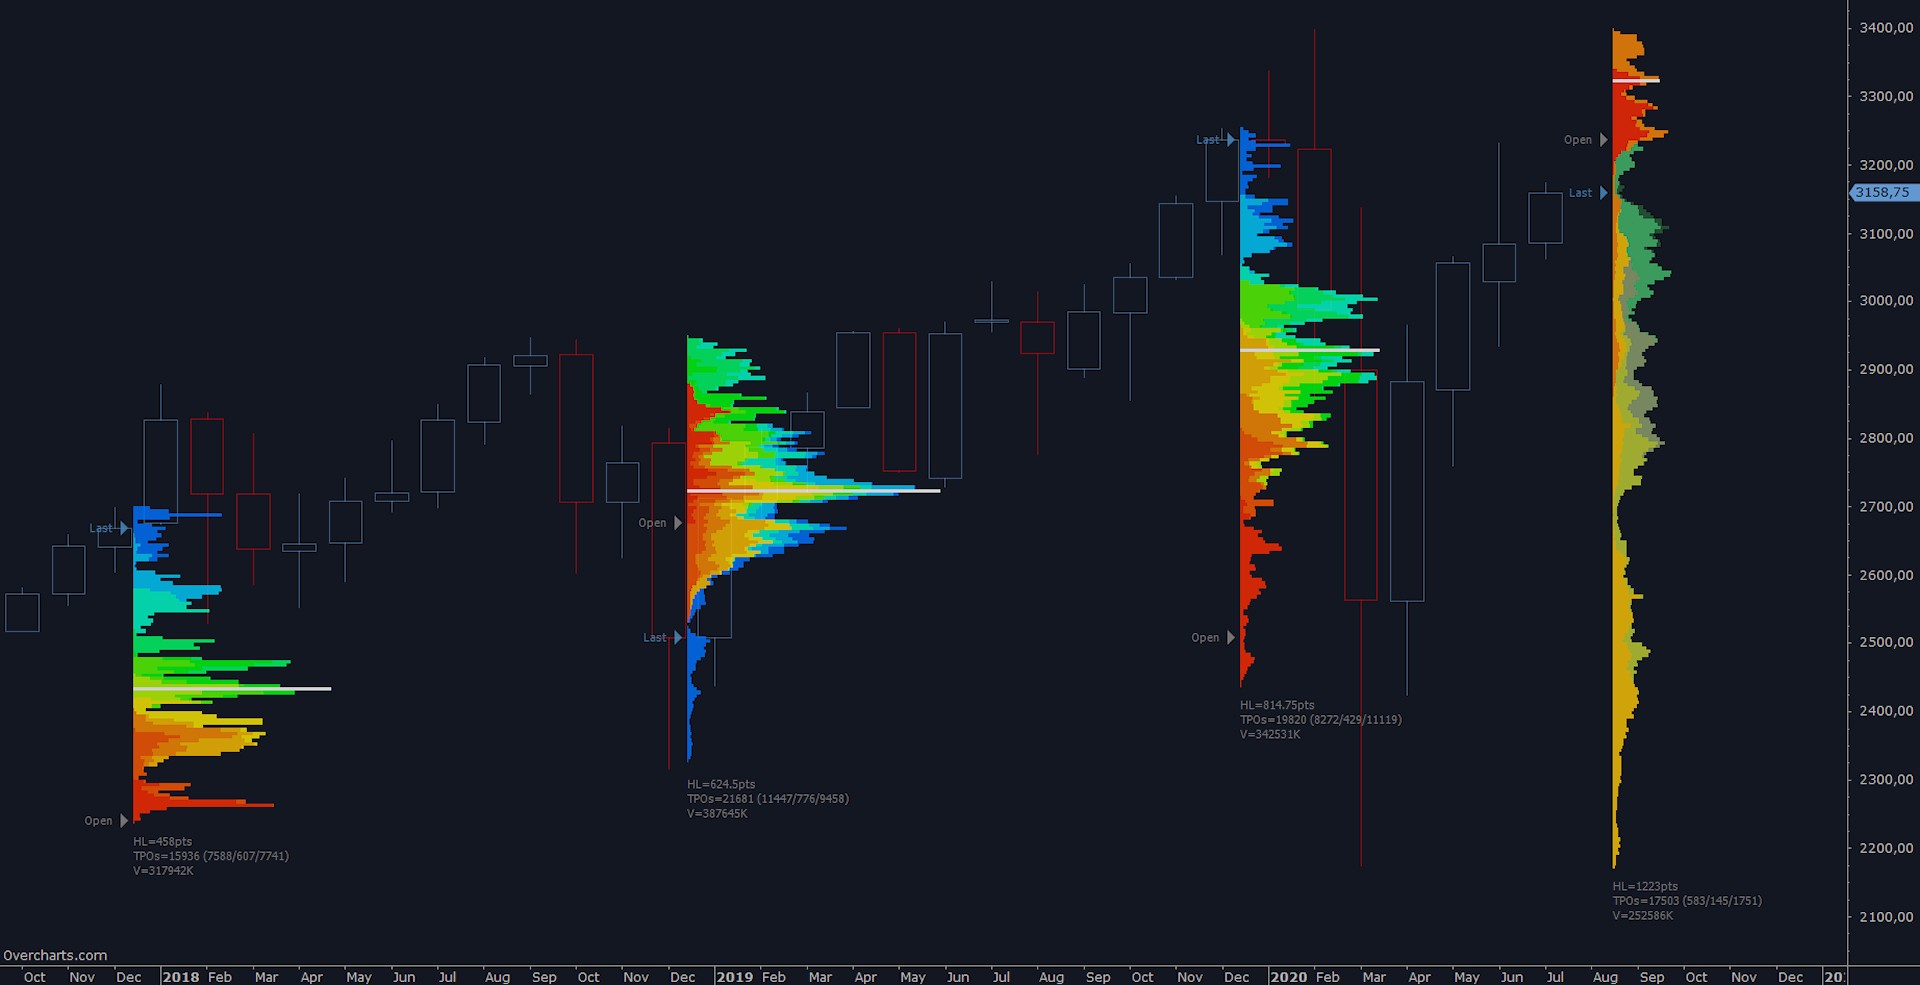
The Long-Term TPO Profile is represented by a sequence of TPO Profiles built on the last x sessions, days, weeks, months or years.
Weekly
Monthly
Yearly
TPO Profile & Volume Profile together
For greater completeness of information you can combine the use of TPO Profile with Volume Profile by adding both indicators on the same chart.
