CHART ANALYSIS
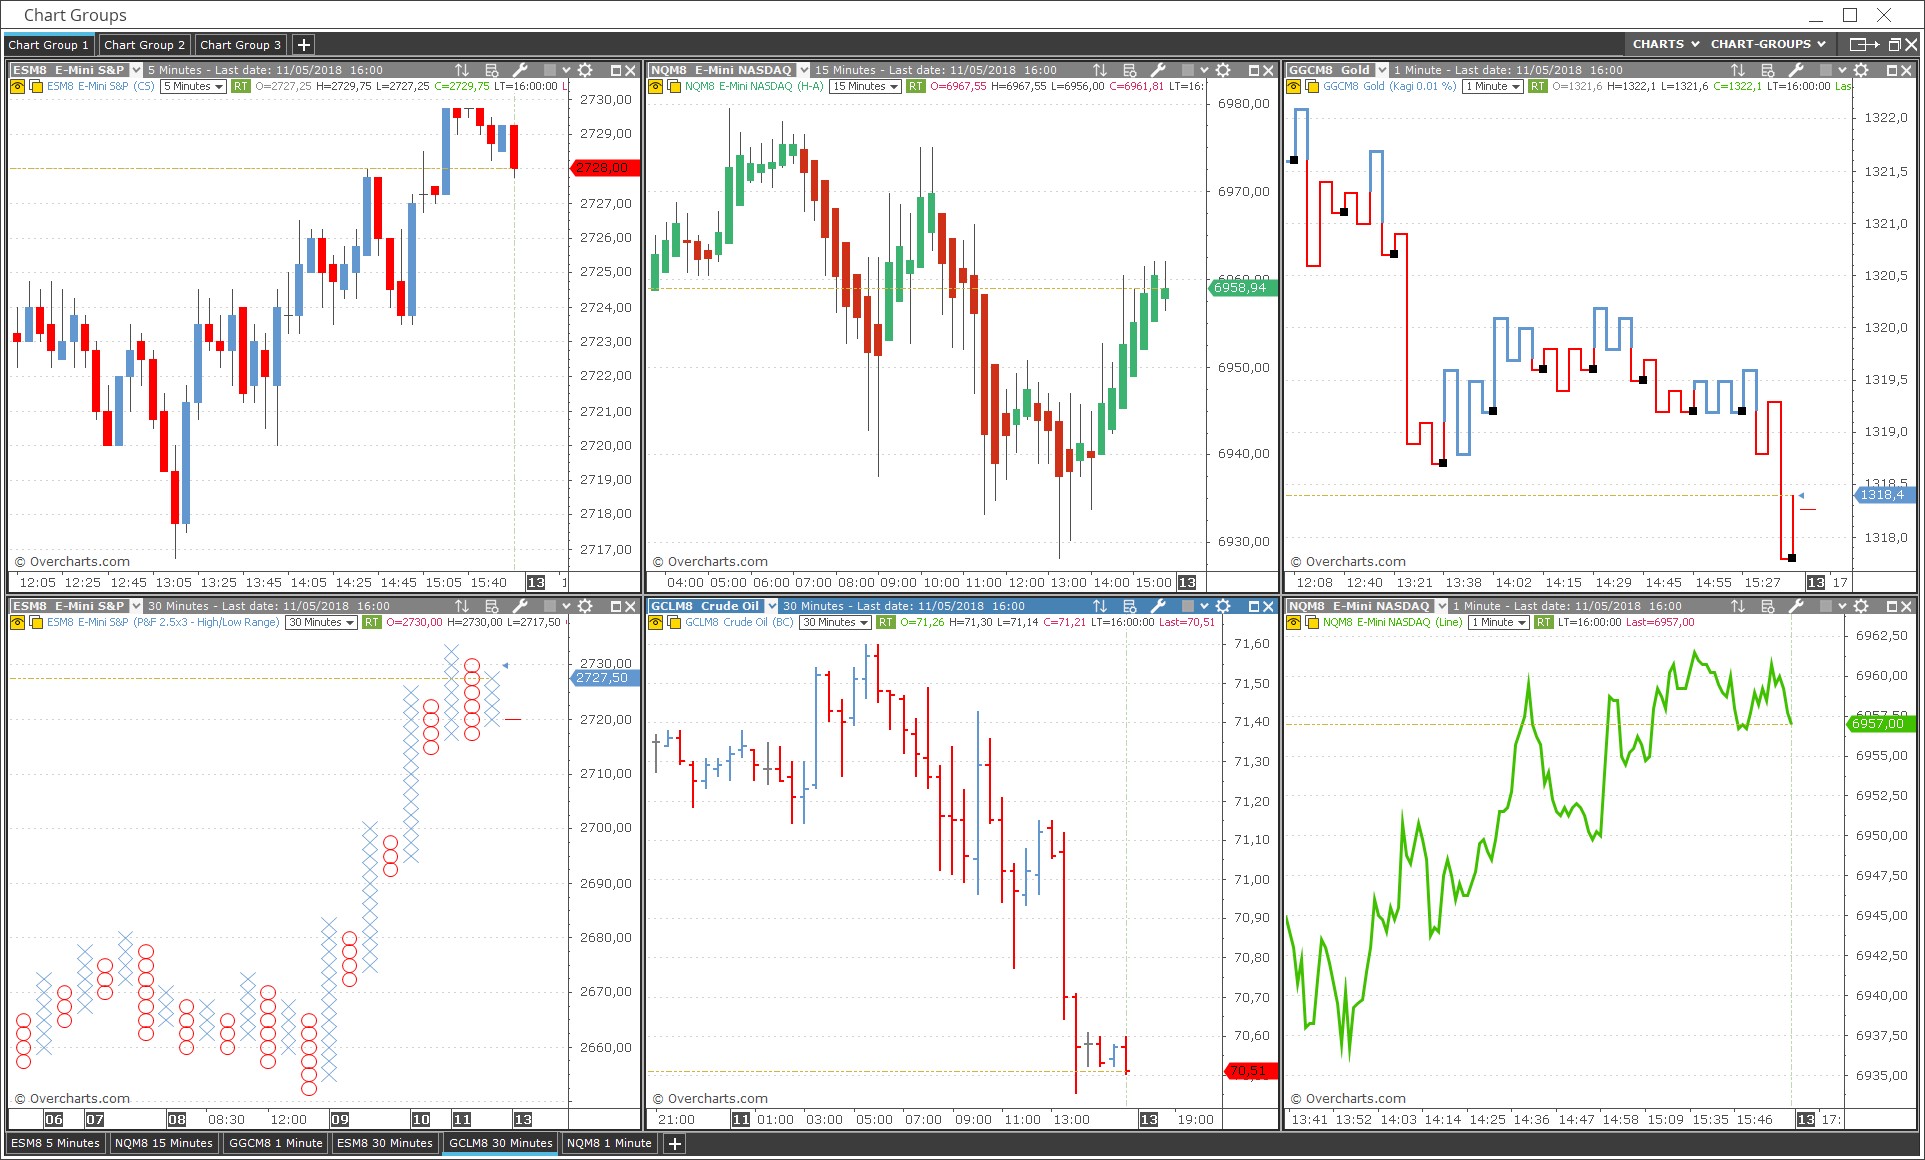
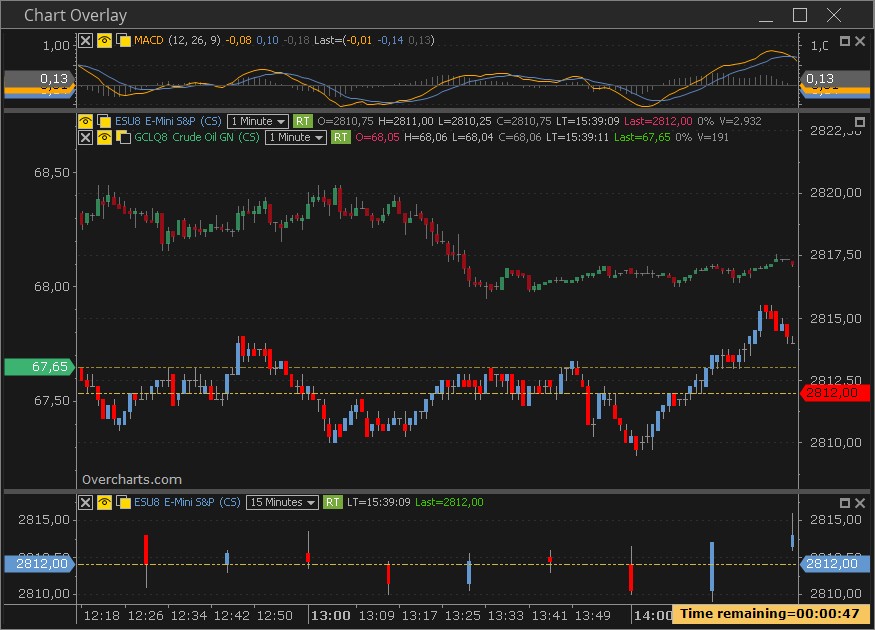
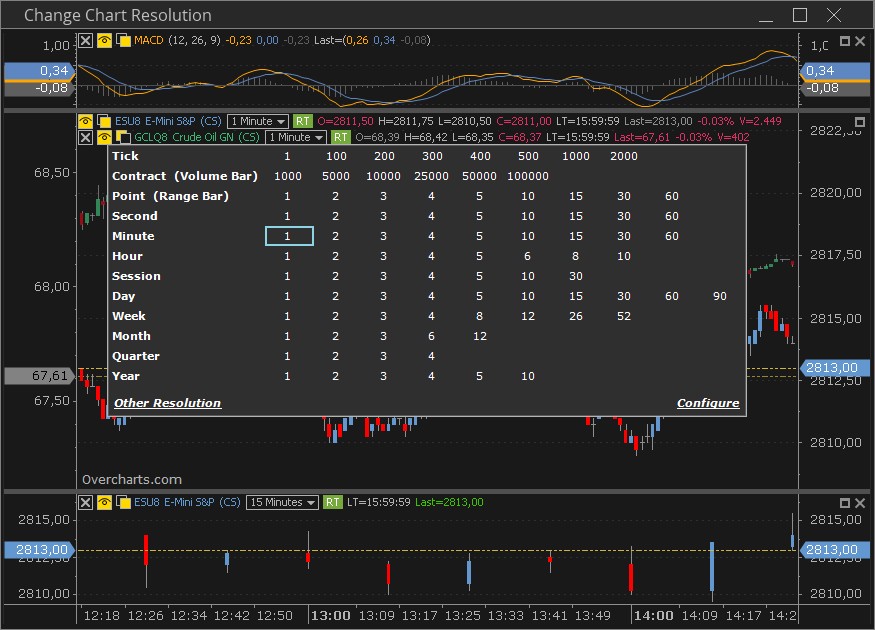
With a 4k Ultra-HD graphics engine, Overcharts allows you to make an advanced technical analysis using many types of charts. In the same window you can insert indicators and charts of the same instrument (or different instruments) with any resolution. Each chart (or data series) can display up to 100 million bars on a 64-bit operating system. Advanced Drawing tools are available: Trendline, Fibonacci, Elliott, Pitchfork, numerous Channel types, Measurement tools and many others.

Each chart can contain millions of bars while keeping the real time performance unchanged
For each chart you can choose the session, time zone, and holidays list
Hundreds of properties to customize charts, indicators, drawing tools


