MARKET DEPTH MAP

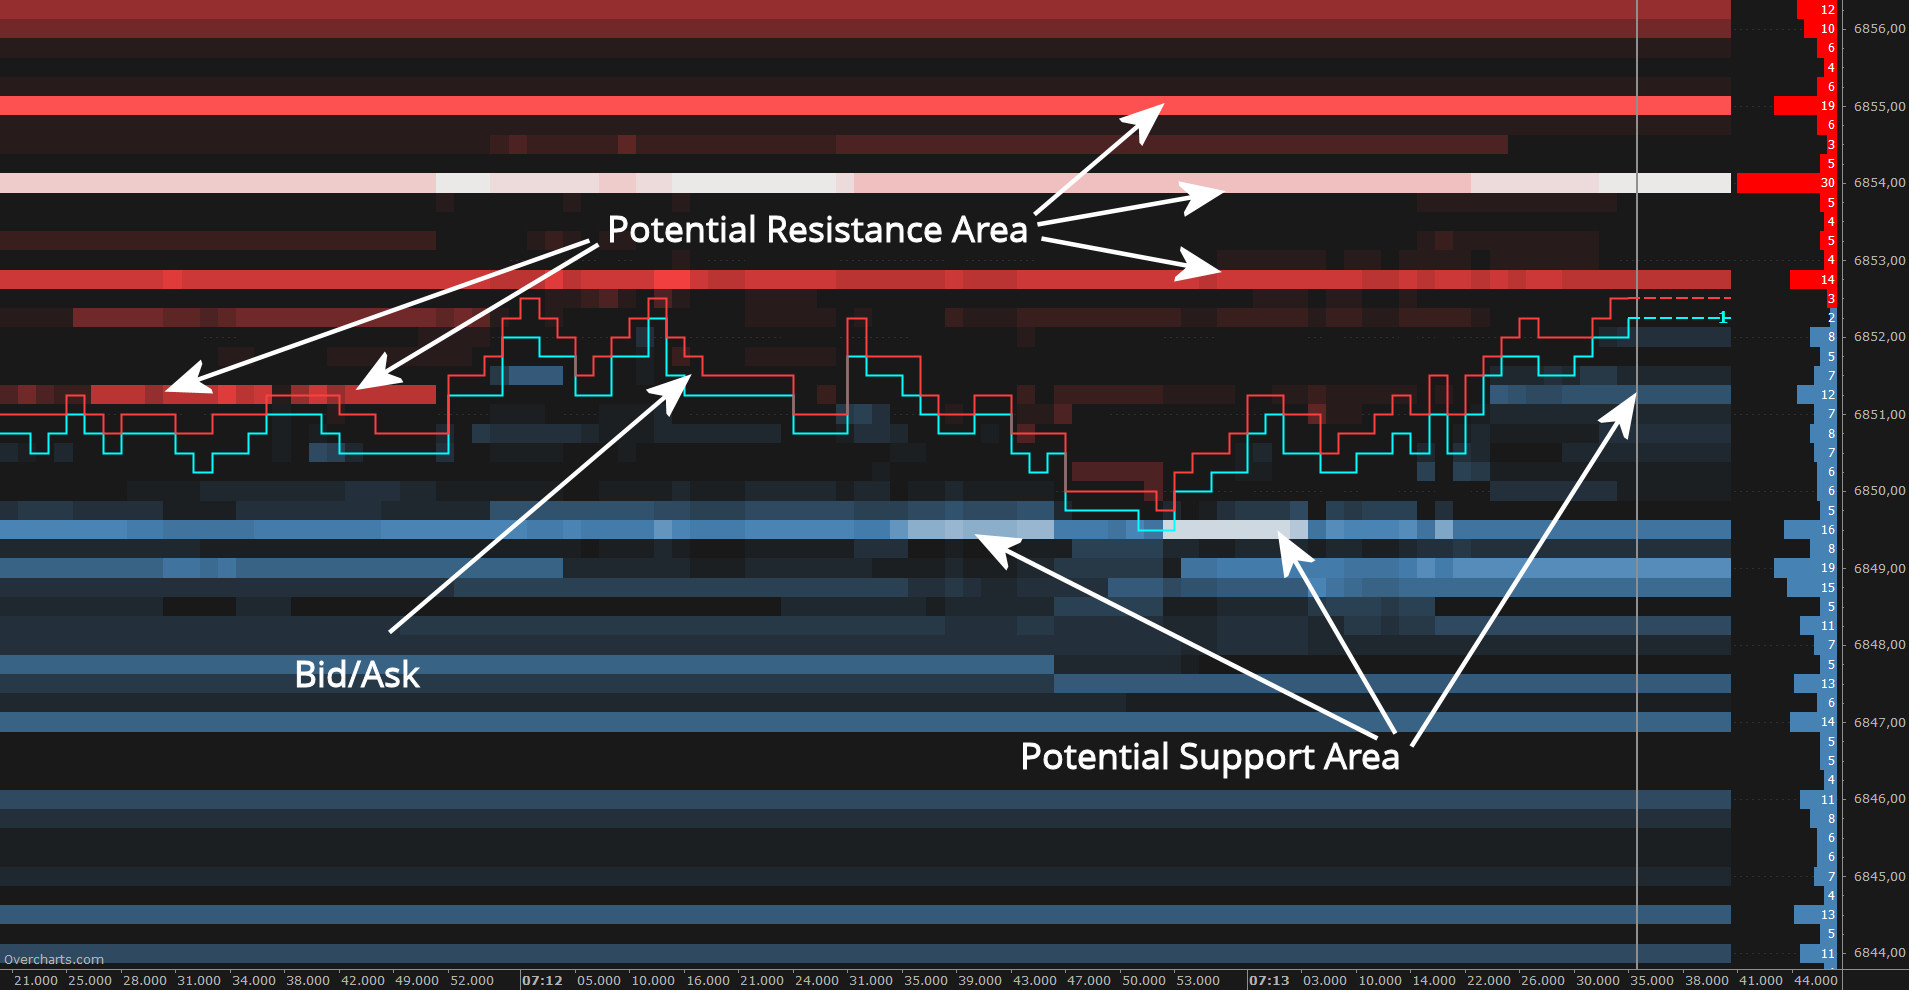
The Market Depth Map helps traders identify potential levels of support and resistance by analyzing the volumes of limit order book (DOM).

Each price level takes on a different color depending on the volume of corresponding DOM level. The higher the volume, the greater the intensity of color and, the greater the intensity of color, the higher the probability of identifying a support or resistance.
Market Depth Map helps traders identify potential levels of support and resistance

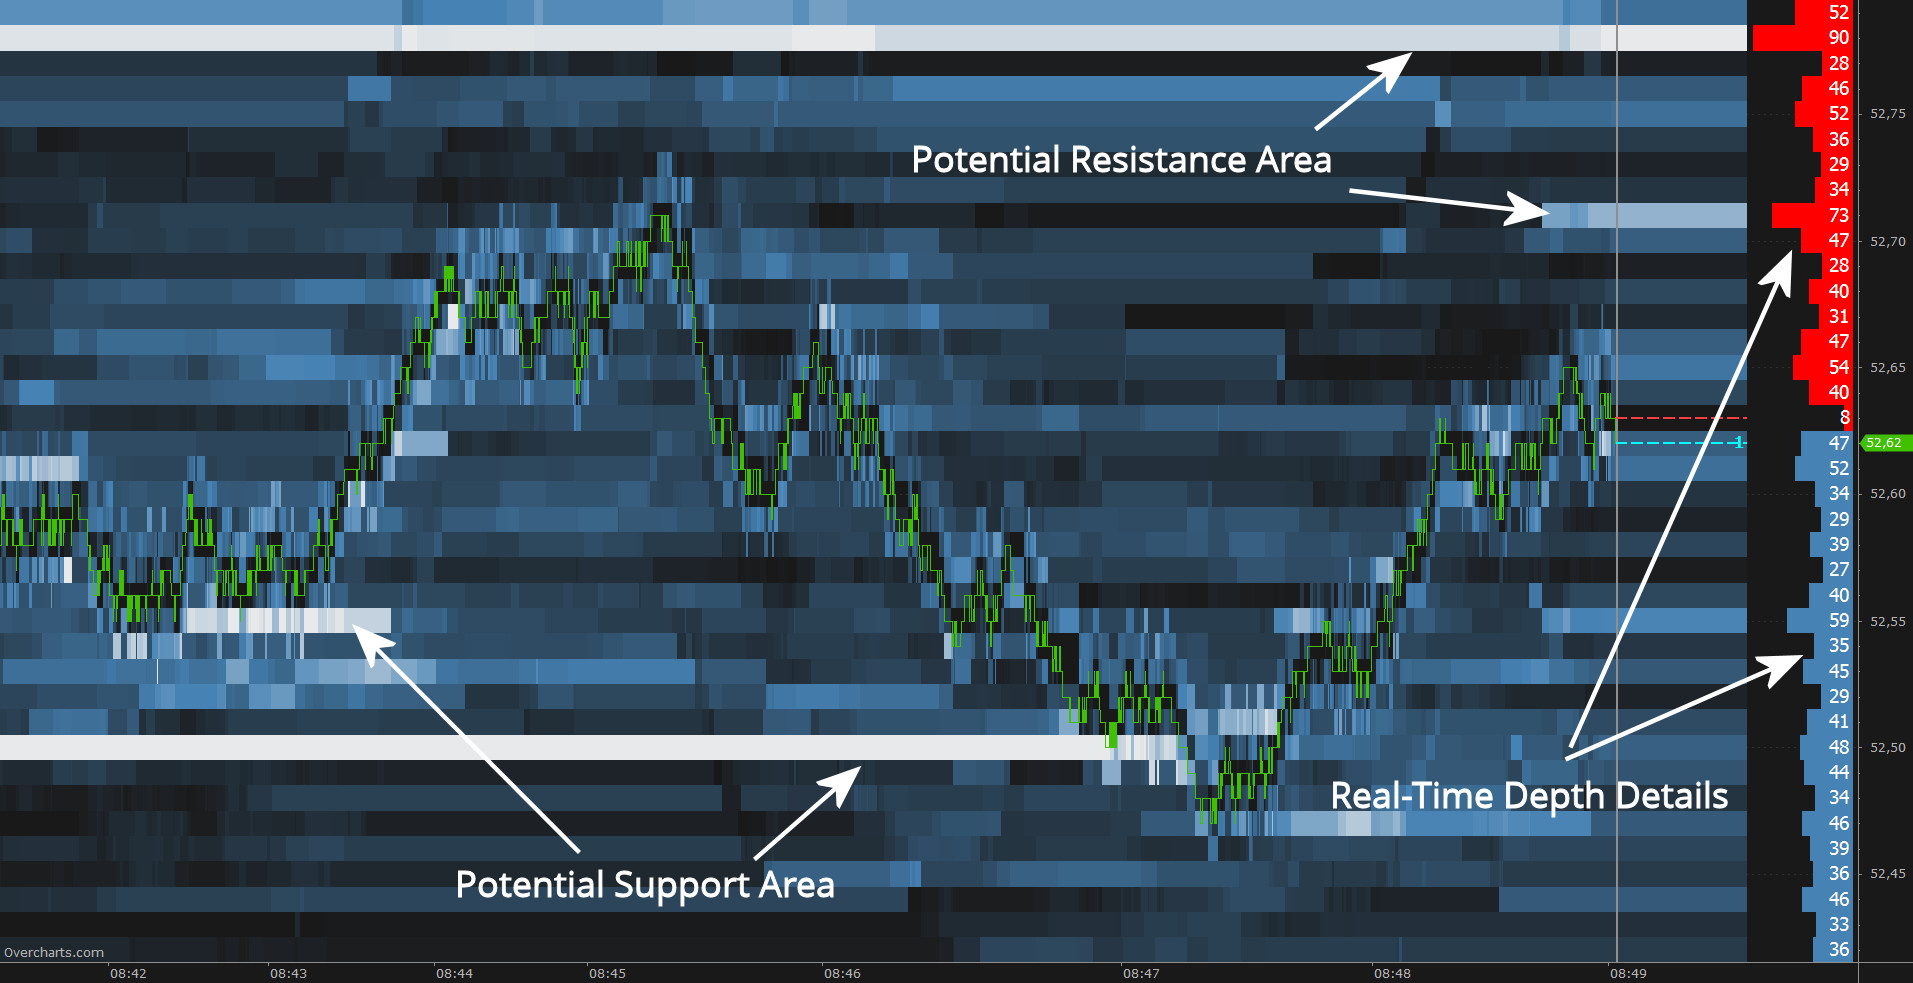
Each Price level takes on a different color depending on the volume of corresponding DOM levels. The higher the volume, the greater the intensity of the color on the chart. This also correlates to a higher probability of identifying a support or resistance level.

  • The indicator works only in real-time with limit order book (DOM) data. Initially this indicator does not display historical data.
  • Overtime, real-time data from the DOM is collected and displayed on screen at each price level, respective to the amount of volume at that level.
  • The higher the volume, the more intense the color will be. This type of coloration, called a heatmap, is very efficient in identifying potential levels of support and resistance.

Fully customizable

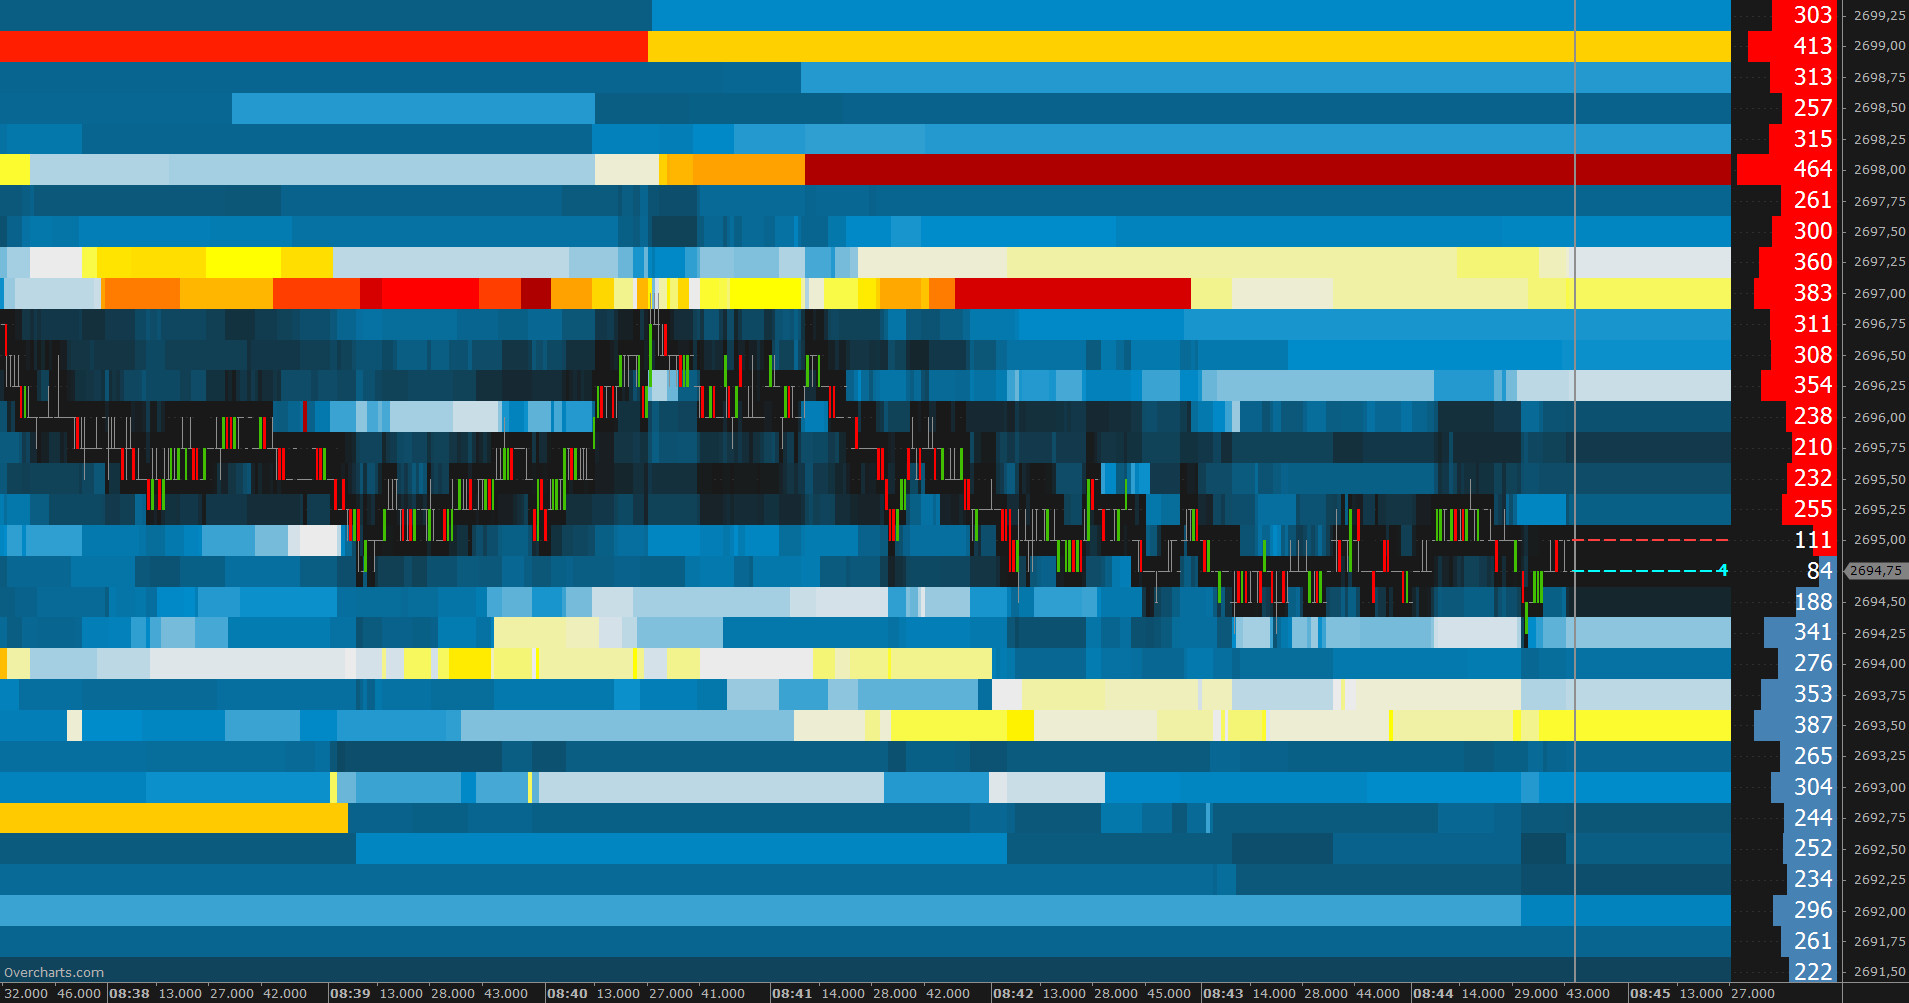
The Market Depth Map is fully customizable according to user preferences. For example, the price levels can be colored in single color, multiple colors or by Bid/Ask area.

You can choose what to display on screen, the refresh rate, how to aggregate the segments within the same level, whether or not to filter volumes and much more.

The current DOM (market depth) can be displayed on the right.

To complete the indicator, you can also display the Bid/Ask curve.